QC story – Complete guide (QC story 7 steps)
QC story is one of the known methodologies to work on problem-solving. Here in this post, you will find the complete 7 steps of the QC story.
As a quality engineer, you will be working on problem-solving scenarios in the organization.
And the concept of QC story is the same to solve problems using the step-by-step approach to solve the problem by assigning the project and completion.
Table of Contents

Introduction to QC Story
Before going for the detailed concept the application of QC Story is not only to quality problems but also to increase productivity, process cost, process performance , supply chain, etc., problems.
It is a means of communication, therefore QC story is both a problem-solving tool and also often a communication tool.
Why QC Story? | What is the purpose of QC story?
QC story is the way of problem presentation and demonstrates in a clear and easy manner to all organization levels.
It will benefit all employees who can understand the problems, their possible root causes , and the work processes. And all the responsible persons are included in the problem-solving.
Therefore a QC story is the documented process for better understanding to explain work procedures during the improvement efforts.
“QC STORY” is a problem-solving technique based on the examination of facts and data, with no speculation, intended for problems caused by a number of issues.
Years later, Nissan introduced it throughout the company, and the QC Story became one of the indispensable methods for Nissan’s increasing quality and productivity.
On the European continent, QC Story was introduced in 1992 at the Nissan factory in Sunderland (G.B.) later in Barcelona.
The Renault-Nissan Alliance is the occasion, within the framework of the SPR. to understand the reasons for this successful generalization of QC Story and to apply for its benefits.
So let’s dive into the steps involved in QC Story
Step1: Problem Definition / Problem justification – Emergency response
1.1 brief description of problem:.
It should include details of 5W-2H ; present level and target
- What…happened?
- Where…did it happen?
- When…did it happen?
- Who…is complaining?
- Why…is ‘who’ complaining?
- How…was it discovered?
- How big…from the problem?

Here you need to specify the Current level based on the average data for the last 4 to 6 months.
1.2 Justification Use Trend graph or Pareto, Occurrence and/or severity as applicable
In this section, you will explain why we are working on this problem. And we have here the complete justification that for the purpose of solving this problem we will work to resolve the same.
We need to show how we know this is a problem.
1.3 Emergency Response:
If immediate protection of the customer is required, then this step can be included. Otherwise, it can be ignored. It can include containment action and immediate action to all over the operations and supply chain.
On successful implementation of step 4, this action should be removed.
Step 2: Observation of process – Understand the current situation

2.1 Observation of process
Prepare/use process flow diagram if required
Perform process walkthrough to verify if there is any non-adherence to standard practice, Specification/ SOP/ Control plan, etc.
2.2 Understand the current situation
Understand the situation based on Time-to-time, person-to-person, stream-to-stream, location-to-location, changes as applicable in the study.
Use of Sketches, photos, stratification , run chart, concentration diagram, histogram , control chart , etc as applicable

Here is where we explained the status of the issue before we started working to improve it.
Step 3: Analysis: Possible causes, probable causes – Testing of hypothesis and root causes
3.1 identify the possible & probable causes.
Use Cause & Effect diagram to identify possible causes

Use Experience, Engineering Judgment, Practical check on possible causes and eliminate invalid causes and arrive at the probable cause
3.2 Confirm the probable causes
Carry out Test of Hypothesis on Probable causes:
Apply Test of hypothesis based on the factual data. Decide validation of cause logically. You can use
- Good and bad product comparison
- Statistical comparative tools
- Change analysis on product or process since product/process launch
- Any other appropriate data-based tool
3.3 Identify the root causes
List the validated causes based on the above step using the root cause analysis .
Step 4: Actions
Carry out why-why analysis on valid causes & identify actions. Consider various probable actions.
Assign each corrective action a priority and stick to it. Involve the operators.
The use of color, limits, graphics, and instructions at the place where the corrective measure is to be applied are effective means of drawing attention to it.
Share the results with all interested parties!
Consider effectiveness expected, cost, ease of implementation, productivity, etc. to prioritize the solution
Step 5: Check
5.1 verify the results.
- Represent the data in the same way as in step 1.2
- Check the result in comparison with If expected result.
- If the expected result is not achieved seek an alternate action plan.

5.2 Carry out full-scale implementation :
Include appropriate data and graph to verify the results as mentioned in the justification (before & after etc)
5.3 Quantify Tangible benefits
a) return on investment b) annualized savings
If the effects can be convert into gains (financial), this is preferable e.g. Return on investment, annualized savings
As far as possible, the effect of each action on the final result must be shown (by numbering them).
Step 6: Standardization
6.1 updating of documents.
Update all the relevant documents like Drawings/specifications, PFD, PFMEA , Control Plan, SOP, Checklist , etc. & mention the reference of the same.
6.2 Training
If the problem stems from the operating procedure, train the operator on the new standard.
Train people on new/modified SOP.
Train people to modify/develop SOS.

6.3 Additional audit or check
Check the quality level and how the operator functions with the new method/procedure for at least two weeks.
Carry out additional audits/checks to ensure adherence to the new
system & monitoring results achieved
we explain the steps that were to ensure that the implemented solution remains effective. We want to prevent the process from reverting to its previous so we can continue to hold the gains achieved by the process improvement.
Step 7: Conclusion

Finally, once we take all necessary actions and solve the problem, all results with progress are report to management. And an action plan is drawn for the causes that cannot be resolved now.
7.1 Horizontal deployment
Do the horizontal deployment by implementing the same actions to similar product and process steps.
7.2 Lessons learned
Summarize the learning from the project and in this last section, we list the problems that could be addressed next and the issue that has been selected to be the next project.
7 Step QC story
Related Posts

Cost of Quality | Quality engineer essential guide

Total Quality Management (TQM) Fundamentals

SIPOC – The complete guide

Root cause analysis

7 Management and Planning Tools

CAPA | Corrective Action & Preventive Action

The QC Story Procedure
by: Quest Claire

I understand the importance of the role of my supervisor, VP Merchandising, with a primary objective of putting merchandise on the retail floor and having products ready to be shipped from the warehouse when customers’ orders come. Any recommended process improvement actions must be clearly understood, backed by reasons, and supported by evidence. If there is a possibility that a process improvement action may delay or may add costs to the process, such an impact must be reviewed carefully with relevant quality cost analysis. Process improvement actions should only be taken when the company management sees an overall cost reduction. Otherwise, recommended actions will be recognised simply as imagination or desk theory and perceived as bad for the business.
People in the manufacturing industry often say quality is everybody’s business. A consumer product can easily contain dozens of parts and materials contributing to product quality. If any of them is located out of its tolerance for its intended use, the product will be defective. Unless a process improvement plan is clear and logical, getting management support for implementation won’t be easy. In other words, the management wants to understand how a program is implemented. The next question is what tool is available. To impress the management, I DO have a program that has been carefully designed, will be carried out step-by-step, will provide opportunities to verify its effectiveness during its rollout, and will complete with measurable goals. Therefore, I consider that the QC Story Procedure tool is the right one as it is easy to understand and use. I expect that the management would likely be convinced about the plan’s effectiveness and render necessary support. I believe the tool contains clear concepts and maintains a fluid flow of thoughts followed by logical conclusions. The QC Story Procedure tool is explained as follows:

The QC Story Procedure is designed for problem-solving. A problem is defined in the QC Story as:
A problem is the undesirable result of a job.

- Show that the problem being handled is of much greater importance than any other problems.
- Show what the background of the problem is and what its cause has been so far.
- Express in concrete terms only the undesirable results of poor performance. Demonstrate the performance loss in the present situation and how much it should be improved.
- Set up a theme and a target, and sub-themes if necessary.
- Nominate a person to take charge of the task officially. When a team carries out the study, nominate the members and the leader.
- Present an estimated budget for the improvement.
- Make a schedule for the improvement.

2 Observation
Investigate the specific features of the problem from a wide range of different viewpoints.
- Investigate four points (time, place, type, and symptom) to discover the features of the problem.
- Then investigate from many different points of view to discover the variation in the results.
- Go to the site and collect the necessary information that cannot be put into a data form.

Find out what the main causes are.
- Write down a cause-and-effect diagram (a diagram that contains all elements seemingly related to the problem) to collect all knowledge concerning possible causes.
- Use the information obtained in the observation step and delete any elements that are not relevant; revise the cause-and-effect diagram using the remaining elements.
- Mark those elements in the latter diagram which seem to have a high possibility of being the main causes.
- From elements with a high possibility of being caused, devise a new plan to ascertain the effect those elements have on the problem by obtaining new data or carrying out experiments.
- Integrate all the information investigated and decide which are the main possible causes.
- If possible, intentionally reproduce the problem.

- A strict distinction must be made between actions taken to cure phenomena (immediate remedy) and activities brought to eliminate cause factors (preventing recurrence).
- Ensure the actions do not produce other problems (side effects). If they do, adopt other measures or devise remedies for the side effects.
- Devise several different proposals for action, examine the advantage and disadvantages of each and select those to which the people involved agree.

Make sure the problem is prevented from occurring again.
- In the same format (tables, graphs, charts), compare the data obtained on the problem (undesirable results in the theme) before and after the action has been taken.
- Convert the effects into monetary terms and compare the result with the target value.
- If there are any other effects, good or bad, list them.

6 Standardization
Eliminate the cause of the problem permanently.
- The five Ws and one H: who, when, where, what, why and how, for the improved job must be identified and used as a standard.
- Necessary preparation and communication regarding the standards should be carried out correctly.
- Education and training should be implemented.
- A responsibility system must be set up to check whether the standards are being observed.

7 Conclusion
Review the problem-solving procedure and plan future work
- Sum up the problems remaining.
- Plan what is to be done to solve those problems.
- Think about what has gone well and badly in the improvement activities.
- DAM – Daily Audit Management
- APS – Advanced Problem Solving
- TMM – Total Maintenance Management
- SAM – Small Activity Management
- PMB – Performance Management Board
- ESB – Enterprise Schedule Builder
- EPP – Enterprise Project Planner
- VCB – Visual communication board
- BDM – Business Document Management
- 5 Whys Analysis
- TPM – Total Productive Maintenance
- PDCA and DEMING CYCLE
- Work Standardization
- Lean production
QC STORY and PROBLEM SOLVING

QC Story is a tool of TQM (Total Quality Management) , which is intended to solve problems in a structured way . QC story is based on the principle of PDCA , where the nine steps can present the full story of the choice of the case to complete solutions.
QC Story tool is not among the most popular in the world, although in content and purpose, it is the same or identical to the more familiar A3 analysis . Usually, it is formalized on a sheet of paper or even on a billboard or poster. Larger formats, such as 2x2 meters, are popular especially in companies with well-developed visual management .
For a clear and visually displayed case in the form of the story , it allows for a better breakdown of the problem and resolution and especially understanding.
The disadvantage of such impressions is that there is relatively difficult to control information and the database. Therefore we developed a DIGITAL LEAN tool , which facilitates managing information and displaying them on each occasion, on any media, like a computer, or LCD screen.
The solution we named APS - Advanced Problem Solving and made it universal since it can be used in addition to the QC story and also replace other traditional tools such as A3, 8D report . Even more, with APS tool we can implement the projects of chronic losses elimination and other projects based on the PDCA, DMAIC …, more structured and efficient.
What is the purpose of the tools QC story?
Problem-solving is now crucial for any company that wants to be competitive. Instead of merely a corrective or fire campaign, we want to determine the root causes of why a problem occurred and found solutions. This means that we are focused on continuous improvement in all areas, from quality, safety, reliability, cost ...
QC story, however, is not merely a problem-solving tool, but also a communication tool . It's a way to present the problem in a clear and understandable manner to a wider range of employees. So all employees understand the work processes and the root causes of the caused problems. Gradually, in solving problems, all employees begin to include, including operators, which means for them the new challenges in the workplace and creating new higher value-added.
Related posts
How to find the root cause for major breakdown.
Failure-based root cause analysis is a method of problem-solving used for identifying the root causes of failure analysis for those employed in engineering and maintenance. TMM - Total Maintenance Management is an innovative computer tool for solving major breakdowns or...
LEAN ACADEMY
LEAN ACADEMY We are happy to share some highlights from our LEAN ACADEMY event. We thank all participants for their presence and support. We especially thank Mr Boris Šturm from the company Polycom for a fascinating and informative presentation of...
PROJECT MANAGEMENT
5 PHASES of PROJECT MANAGEMENT You probably know Benjamin Franklin's famous quote, "If you fail to plan, you are planning to fail." Planning is a prerequisite for successful work and successful projects. However, in practice, we usually pay too little...
7 Basic Tools of Quality for Process Improvement
Japan is known worldwide for its quality products and services. One of the many reasons for this is its excellent quality management. How did it become so? Japan has Dr. Kaoru Ishikawa to thank for that.
Postwar Japan underwent a major quality revolution. Companies were focused on training their employees in statistical quality control. But soon they realized that the complexity of the subject itself could intimidate most of the workers; so they wanted more basic tools.
Dr. Kaoru Ishikawa, a member of the Japanese Union of Scientists and Engineers (JUSE), took it to his hands to make quality control easier for everyone – even those with little knowledge of statistics – to understand. He introduced the 7 basic tools of quality. They were soon adopted by most companies and became the foundation of Japan’s astonishing industrial resurgence after World War 2.
This post will describe the 7 basic quality tools, how to use them and give you access to templates that you can use right away.
Quality Tools: What Are They?
How can teams and organizations use the 7 basic quality tools, cause and effect diagram, scatter diagram, check sheets.
- Control chart
- Pareto chart
The 7 basic tools of quality, sometimes also referred to as 7 QC tools – represent a fixed set of graphical tools used for troubleshooting issues that are related to quality.
They are called basic quality tools because they can be easily learned by anyone even without any formal training in statistics. Dr. Kaoru Ishikawa played the leading role in the development and advocacy of using the 7 quality tools in organizations for problem-solving and process improvement.
The 7 basic quality tools include;
- Cause-and-effect diagram
- Scatter diagram
- Check sheet
The 7 quality tools were first emphasized by Kaoru Ishikawa a professor of engineering at the University of Tokyo, who is also known as the father of “Quality Circles” for the role he played in launching Japan’s quality movement in the 1960s. During this time, companies were focused on training their employees in statistical quality control realized that the complexity of the subject could intimidate most of the workers; hence they opted for simpler methods that are easy to learn and use. 7 basic tools of quality were thus incorporated company-wide.
Quality tools are used to collect data, analyze data, identify root causes, and measure results in problem-solving and process improvement. The use of these tools helps people involved easily generate new ideas, solve problems, and do proper planning.
- Structured approach: They provide a systematic approach to problem-solving and process improvement, ensuring that efforts are well-organized and focused.
- Data-driven decision making: The tools enable data collection, analysis, and visualization, empowering teams to make informed decisions based on evidence.
- Improved communication and collaboration: Visual representations and structured tools facilitate effective communication and collaboration among team members, leading to shared understanding and alignment.
- Problem identification and prioritization: The tools help identify and prioritize problems or improvement opportunities, enabling teams to allocate resources efficiently and address critical issues first.
- Continuous improvement: By using these tools, teams can establish a culture of continuous improvement, as they provide a framework for ongoing monitoring, analysis, and refinement of processes.
7 Basic Quality Tools Explained with Templates
The 7 quality tools can be applied across any industry. They help teams and individuals analyze and interpret the data they gather and derive maximum information from it.
Flowcharts are perhaps the most popular out of the 7 quality tools. This tool is used to visualize the sequence of steps in a process, event, workflow, system, etc. In addition to showing the process as a whole, a flowchart also highlights the relationship between steps and the process boundaries (start and end).
Flowcharts use a standard set of symbols, and it’s important to standardize the use of these symbols so anyone can understand and use them easily. Here’s a roundup of all the key flowchart symbols .
- To build a common understanding of a process.
- To analyze processes and discover areas of issues, inefficiencies, blockers, etc.
- To standardize processes by leading everyone to follow the same steps.
Real-world examples of usage
- Documenting and analyzing the steps involved in a customer order fulfillment process.
- Mapping out the workflow of a software development lifecycle.
- Visualizing the process flow of patient admissions in a hospital.
Enhances process understanding, highlights bottlenecks or inefficiencies, and supports process optimization and standardization efforts.
How to use a flowchart
- Gather a team of employees involved in carrying out the process for analyzing it.
- List down the steps involved in the process from its start to end.
- If you are using an online tool like Creately , you can first write down the process steps and rearrange them later on the canvas as you identify the flow.
- Identify the sequence of steps; when representing the flow with your flowchart, show it from left to write or from top to bottom.
- Connect the shapes with arrows to indicate the flow.
Who can use it?
- Process improvement teams mapping and documenting existing processes for analysis.
- Business analysts or consultants analyzing workflow and process optimization opportunities.
- Software developers or system designers documenting the flow of information or interactions in a system.
To learn more about flowcharts, refer to our Ultimate Flowchart Tutorial .

A histogram is a type of bar chart that visualizes the distribution of numerical data. It groups numbers into ranges and the height of the bar indicates how many fall into each range.
It’s a powerful quality planning and control tool that helps you understand preventive and corrective actions.
- To easily interpret a large amount of data and identify patterns.
- To make predictions of process performance.
- To identify the different causes of a quality problem.
- Analyzing the distribution of call wait times in a call center.
- Assessing the distribution of product weights in a manufacturing process.
- Examining the variation in delivery times for an e-commerce business.
Provides insights into process performance and variation, enabling teams to target areas for improvement and make data-driven decisions.
How to make a histogram
- Collect data for analysis. Record occurrences of specific ranges using a tally chart.
- Analyze the data at hand and split the data into intervals or bins.
- Count how many values fall into each bin.
- On the graph, indicate the frequency of occurrences for each bin with the area (height) of the bar.
- Process engineers or data analysts examining process performance metrics.
- Financial analysts analyzing expenditure patterns or budget variances.
- Supply chain managers assessing supplier performance or delivery times.

Here’s a useful article to learn more about using a histogram for quality improvement in more detail.
This tool is devised by Kaoru Ishikawa himself and is also known as the fishbone diagram (for it’s shaped like the skeleton of a fish) and Ishikawa diagram.
They are used for identifying the various factors (causes) leading to an issue (effect). It ultimately helps discover the root cause of the problem allowing you to find the correct solution effectively.
- Problem-solving; finding root causes of a problem.
- Uncovering the relationships between different causes leading to a problem.
- During group brainstorming sessions to gather different perspectives on the matter.
- Investigating the potential causes of low employee morale or high turnover rates.
- Analyzing the factors contributing to product defects in a manufacturing process.
- Identifying the root causes of customer complaints in a service industry.
Enhances problem-solving by systematically identifying and organizing possible causes, allowing teams to address root causes rather than symptoms.
How to use the cause and effect diagram
- Identify the problem area that needs to be analyzed and write it down at the head of the diagram.
- Identify the main causes of the problem. These are the labels for the main branches of the fishbone diagram. These main categories can include methods, material, machinery, people, policies, procedures, etc.
- Identify plausible sub-causes of the main causes and attach them as sub-branches to the main branches.
- Referring to the diagram you have created, do a deeper investigation of the major and minor causes.
- Once you have identified the root cause, create an action plan outlining your strategy to overcome the problem.
- Cross-functional improvement teams working on complex problems or process improvement projects.
- Quality engineers investigating the root causes of quality issues.
- Product designers or engineers seeking to understand the factors affecting product performance.

The scatter diagram (scatter charts, scatter plots, scattergrams, scatter graphs) is a chart that helps you identify how two variables are related.
The scatter diagram shows the values of the two variables plotted along the two axes of the graph. The pattern of the resulting points will reveal the correlation.
- To validate the relationship between causes and effects.
- To understand the causes of poor performance.
- To understand the influence of the independent variable over the dependent variable.
- Exploring the relationship between advertising expenditure and sales revenue.
- Analyzing the correlation between employee training hours and performance metrics.
- Investigating the connection between temperature and product quality in a production line.
Helps identify correlations or patterns between variables, facilitating the understanding of cause-and-effect relationships and aiding in decision-making.
How to make a scatter diagram
- Start with collecting data needed for validation. Understand the cause and effect relationship between the two variables.
- Identify dependent and independent variables. The dependent variable plotted along the vertical axis is called the measures parameter. The independent variable plotted along the horizontal axis is called the control parameter.
- Draw the graph based on the collected data. Add horizontal axis and vertical axis name and draw the trend line.
- Based on the trend line, analyze the diagram to understand the correlation which can be categorized as Strong, Moderate and No Relation.
- Data analysts exploring relationships between variables in research or analytics projects.
- Manufacturing engineers investigating the correlation between process parameters and product quality.
- Sales or marketing teams analyzing the relationship between marketing efforts and sales performance.

Check sheets provide a systematic way to collect, record and present quantitative and qualitative data about quality problems. A check sheet used to collect quantitative data is known as a tally sheet.
It is one of the most popular QC tools and it makes data gathering much simpler.
- To check the shape of the probability distribution of a process
- To quantify defects by type, by location or by cause
- To keep track of the completion of steps in a multistep procedure (as a checklist )
- Tracking the number of defects or errors in a manufacturing process.
- Recording customer complaints or inquiries to identify common issues.
- Monitoring the frequency of equipment breakdowns or maintenance needs.
Provides a structured approach for data collection, making it easier to identify trends, patterns, and areas for improvement.
How to make a checksheet
- Identify the needed information.
- Why do you need to collect the data?
- What type of information should you collect?
- Where should you collect the data from?
- Who should collect the data?
- When should you collect the data?
- How should you measure the data?
- How much data is essential?
Construct your sheet based on the title, source information and content information (refer to the example below).
Test the sheets. Make sure that all the rows and columns in it are required and relevant and that the sheet is easy to refer to and use. Test it with other collectors and make adjustments based on feedback.
- Quality inspectors or auditors who need to collect data on defects or issues.
- Process operators or technicians responsible for tracking process parameters or measurements.
- Customer service representatives who record customer complaints or inquiries.

Control Chart
The control chart is a type of run chart used to observe and study process variation resulting from a common or special cause over a period of time.
The chart helps measure the variations and visualize it to show whether the change is within an acceptable limit or not. It helps track metrics such as defects, cost per unit, production time, inventory on hand , etc.
Control charts are generally used in manufacturing, process improvement methodologies like Six Sigma and stock trading algorithms.
- To determine whether a process is stable.
- To monitor processes and learn how to improve poor performance.
- To recognize abnormal changes in a process.
- Monitoring the variation in product dimensions during a manufacturing process.
- Tracking the number of customer complaints received per day.
- Monitoring the average response time of a customer support team.
Enables real-time monitoring of process stability, early detection of deviations or abnormalities, and prompt corrective actions to maintain consistent quality.
How to create a control chart
- Gather data on the characteristic of interest.
- Calculate mean and upper/lower control limits.
- Create a graph and plot the collected data.
- Add lines representing the mean and control limits to the graph.
- Look for patterns, trends, or points beyond control limits.
- Determine if the process is in control or out of control.
- Investigate and address causes of out-of-control points.
- Regularly update the chart with new data and analyze for ongoing improvement.
- Production supervisors or operators monitoring process performance on the shop floor.
- Quality control or assurance personnel tracking variation in product quality over time.
- Service managers observing customer satisfaction levels and service performance metrics.

Pareto Chart
The Pareto chart is a combination of a bar graph and a line graph. It helps identify the facts needed to set priorities.
The Pareto chart organizes and presents information in such a way that makes it easier to understand the relative importance of various problems or causes of problems. It comes in the shape of a vertical bar chart and displays the defects in order (from the highest to the lowest) while the line graph shows the cumulative percentage of the defect.
- To identify the relative importance of the causes of a problem.
- To help teams identify the causes that will have the highest impact when solved.
- To easily calculate the impact of a defect on the production.
- Analyzing customer feedback to identify the most common product or service issues.
- Prioritizing improvement efforts based on the frequency of quality incidents.
- Identifying the major causes of delays in project management.
Helps focus improvement efforts on the most significant factors or problems, leading to effective allocation of resources and improved outcomes.
How to create a Pareto chart
- Select the problem for investigation. Also, select a method and time for collecting information. If necessary create a check sheet for recording information.
- Once you have collected the data, go through them and sort them out to calculate the cumulative percentage.
- Draw the graph, bars, cumulative percentage line and add labels (refer to the example below).
- Analyze the chart to identify the vital few problems from the trivial many by using the 80/20 rule . Plan further actions to eliminate the identified defects by finding their root causes.
- Quality managers or improvement teams looking to prioritize improvement initiatives.
- Project managers seeking to identify and address the most critical project risks.
- Sales or marketing teams analyzing customer feedback or product issues.

What’s Your Favorite Out of the 7 Basic Quality Tools?
You can use these 7 basic quality tools individually or together to effectively investigate processes and identify areas for improvement. According to Ishikawa, it’s important that all employees learn how to use these tools to ensure the achievement of excellent performance throughout the organization.
Got anything to add to our guide? Let us know in the comments section below.
Join over thousands of organizations that use Creately to brainstorm, plan, analyze, and execute their projects successfully.
FAQs about 7 Basic Quality Tools
Quality problems in an organization can manifest in various forms and affect different areas of operations.
- Product defects: Products may have defects or non-conformities that deviate from quality specifications, leading to customer dissatisfaction, returns, or warranty claims.
- Service errors: Service errors can occur when services do not meet customer expectations, such as incorrect billing, delays in delivery, or inadequate customer support.
- Process inefficiencies: Inefficient processes can lead to delays, errors, or rework, resulting in increased costs, decreased productivity, and customer dissatisfaction.
- Poor design or innovation: Inadequate product design or lack of innovation can lead to products that do not meet customer needs, lack competitive features, or have usability issues.
- Supplier quality issues: Poor quality materials or components from suppliers can affect the overall quality of the final product or service.
- Ineffective quality management systems: Inadequate quality management systems, such as lack of quality standards, processes, or documentation, can contribute to quality problems throughout the organization.
The basic quality improvement steps typically follow a systematic approach to identify, analyze, implement, and monitor improvements in processes or products.
- Clearly articulate the problem or identify the area for improvement.
- Collect relevant data and information related to the problem.
- Analyze the collected data to identify patterns, root causes, and opportunities for improvement.
- Brainstorm and generate potential improvement ideas or solutions.
- Assess the feasibility, impact, and effectiveness of the generated improvement ideas.
- Develop an action plan to implement the chosen solution.
- Continuously monitor and measure the results of the implemented solution.
- Based on the monitoring results, evaluate the effectiveness of the implemented solution.
- Once the improvement is successful, document the new processes, best practices, or standard operating procedures (SOPs).
- Iterate through the steps to continuously improve processes and products.
More Related Articles

Amanda Athuraliya is the communication specialist/content writer at Creately, online diagramming and collaboration tool. She is an avid reader, a budding writer and a passionate researcher who loves to write about all kinds of topics.
7 QC Tools: Your Ultimate Guide To Quality Improvement

Introduction to 7 QC tools
Quality management is an important aspect of any organization, and achieving it requires effective problem-solving strategies. In this regard, the 7 QC tools offer a comprehensive approach to problem-solving and quality improvement. These tools are designed to help organizations identify the root cause of problems, make data-driven decisions, and ultimately improve the quality of their products or services. In this post, we will explore the importance of the 7 QC tools, their history and evolution, how to select the right tool for quality control, and detailed explanations of each of the 7 QC tools.
Importance of 7 QC tools in quality management
The importance of 7 QC tools in quality management cannot be overstated. These tools help organizations to improve quality by providing a systematic approach to problem-solving. They enable organizations to analyze data, identify problem areas, and make data-driven decisions. By using these tools, organizations can reduce costs, increase productivity, and improve customer satisfaction. The 7 QC tools are widely used in various industries, including manufacturing, healthcare, and service sector. They are easy to use, cost-effective, and can be applied to various types of problems.
History and evolution of 7 QC tools
The history and evolution of the 7 QC tools can be traced back to the early 1920s when Dr. Walter A. Shewhart introduced the concept of statistical process control (SPC). Over time, additional techniques were added to the original seven, and the tools evolved to include Pareto charts, cause-and-effect diagrams, check sheets, histograms, scatter diagrams, and control charts. Today, the 7 QC tools are widely used in quality management and have become an integral part of Lean and Six Sigma methodologies.
How to select the right tool for quality control
Here are some points to consider when selecting the right tool for quality control:
- Identify the problem: Before selecting a tool, it is important to clearly identify the problem at hand. This will help determine which tool is best suited for the job.
- Understand the data: Understanding the data available is crucial for selecting the right tool. Some tools are better suited for qualitative data, while others work best with quantitative data.
- Determine the scope: Consider the scope of the problem and the level of detail required to solve it. Some tools are better suited for analyzing specific details, while others provide a more holistic view of the problem.
- Consider the complexity: Some problems are more complex than others, and require more sophisticated tools to solve. Consider the level of complexity and choose a tool that is appropriate for the problem at hand.
- Evaluate the strengths and limitations: Each tool has its own strengths and limitations. It is important to understand these before selecting a tool, so that you can choose one that is best suited for the problem at hand.
- Seek expert advice: If you are unsure which tool to use, seek advice from experts in the field. They can provide valuable insights and help you select the right tool for the job.
By considering these factors, you can select the right tool for quality control and ensure that your problem-solving efforts are effective and efficient.
7 QC Tools Explained
1. Pareto Chart
A Pareto chart is a graph that displays the relative frequency or size of problems in descending order of importance. It is a tool for identifying the most significant causes of a problem or the largest sources of variation in a process. The chart uses a vertical bar graph to show the frequency or size of each problem, with the bars arranged in order of decreasing importance. The chart also includes a cumulative percentage line that shows the cumulative percentage of problems accounted for by each cause. Pareto charts are useful for prioritizing problems and identifying the root causes that should be addressed to have the most significant impact on process improvement.
2. Cause-and-effect diagram
A cause-and-effect diagram, also known as a fishbone diagram or Ishikawa diagram, is a tool used to identify the root causes of a problem. It is a structured approach that helps to identify and categorize the possible causes of a problem, based on the various factors that could contribute to it. The diagram starts with a problem statement at the head of the diagram and uses a structured approach to identify the possible causes, grouping them into categories such as people, process, equipment, materials, and environment. Cause-and-effect diagrams are useful for identifying the root causes of a problem and for organizing and structuring the potential causes in a way that can be easily analyzed and addressed.
3. Check sheet
A check sheet is a tool used to collect data in a structured way. It is a simple form that is used to record data in a standardized format, making it easy to collect and analyze data across different processes or situations. Check sheets can be used to track defects or errors, record the frequency of events, or collect other types of data. They are useful for identifying patterns and trends in data, as well as for tracking progress and improvement over time.
4. Histogram
A histogram is a graph that shows the distribution of data. It is a visual representation of how frequently certain values occur within a set of data, using a series of vertical bars. The bars are grouped into categories or ranges of values, with the height of each bar representing the number of data points that fall within that category. Histograms are useful for identifying the shape of the distribution, including the mean and standard deviation, and for identifying outliers or unusual data points.
5. Scatter diagram
A scatter diagram also known as a scatter plot, is a graph that shows the relationship between two variables. It is a visual representation of how one variable changes in response to changes in the other variable. Each data point is plotted on the graph as a point, with one variable represented on the x-axis and the other variable represented on the y-axis. Scatter diagrams are useful for identifying correlations or patterns in data, and for identifying outliers or unusual data points. They are commonly used in quality control and process improvement to identify relationships between process variables and product quality or performance.
6. Control Charts
A control chart is a tool used to monitor and control a process over time. It is a graphical representation of data collected from a process, plotted against established control limits. The chart shows how the process is performing and alerts the user to any changes or variations that may occur. Control charts are useful for identifying trends, detecting shifts or changes in the process, and for identifying the sources of variation that may be causing problems. They can be used to monitor any process that produces data, from manufacturing to healthcare to financial services.
7. Flow Charts
A flow chart is a diagram that shows the steps in a process or system. It is a visual representation of the sequence of activities involved in a process, from start to finish. Flow charts are used to help understand a process, identify bottlenecks or inefficiencies, and to design or improve a process. The chart consists of boxes, symbols, and arrows that indicate the flow of the process. Boxes represent steps or actions in the process, while arrows represent the flow of materials or information between steps. Flow charts are useful for analyzing and improving any process, from simple to complex, and can be used in a variety of industries, including manufacturing, healthcare, and software development.
7 QC Tools: A Summary Table
These 7 QC tools are often used in combination with each other and with other quality management tools to improve quality and productivity, reduce costs and waste, and enhance customer satisfaction. The 7 QC Tools can be applied across various industries, including manufacturing, healthcare, finance, and service industries. These tools help to identify problems, analyze data, and improve processes, leading to better quality control and customer satisfaction. Knowing how and when to use each tool is essential to their effectiveness and achieving process improvement.
7 QC Tools Limitations:
While the 7 QC tools are widely used and effective for quality management, there are some limitations to their application. Here are some of the common limitations:
- Limited scope: The 7 QC tools are primarily focused on identifying and analyzing data related to quality issues and do not address other important aspects of quality management such as customer satisfaction, process improvement, and strategic planning.
- Lack of guidance: While the 7 QC tools provide a structured approach to data analysis, they do not provide guidance on how to implement solutions or make improvements based on the results.
- Data interpretation: The accuracy and usefulness of the data analyzed using the 7 QC tools depend on the quality and reliability of the data collected. Incorrect data or incomplete data can lead to incorrect conclusions and ineffective solutions.
- Limited application: The 7 QC tools are designed for use in manufacturing and industrial settings, and may not be as relevant or applicable in service industries or other non-manufacturing settings.
- Insufficient for complex problems: The 7 QC tools are useful for identifying and analyzing simple quality problems with a single cause or factor, but may be insufficient for more complex problems that have multiple causes and variables.
- Overreliance on data: The 7 QC tools rely heavily on data analysis and may overlook other important factors that contribute to quality, such as employee involvement, leadership, and culture.
Alternative Approach to 7QC Tools:
There are several other quality management tools and methodologies that organizations can use in addition to or instead of the 7 QC tools. Some of these alternatives include:
- Six Sigma: A data-driven approach to quality management that aims to minimize defects and variability in processes and products by using statistical methods and tools.
- Lean Manufacturing: A methodology focused on reducing waste and improving efficiency in manufacturing processes by eliminating non-value-added activities, streamlining production flows, and increasing responsiveness to customer demands.
- Root Cause Analysis (RCA): A problem-solving technique used to identify the underlying causes of a problem or failure, and develop solutions to prevent recurrence.
- Failure Mode and Effects Analysis (FMEA): A proactive risk management tool that helps identify and mitigate potential failures and defects in products or processes before they occur.
- Statistical Process Control (SPC): A method for monitoring and controlling a process by using statistical techniques to identify and correct deviations and abnormalities in the process.
- Kaizen: A continuous improvement philosophy that emphasizes small, incremental changes in processes and systems, and encourages employee involvement and empowerment.
These tools and methodologies can be used alone or in combination with each other, depending on the specific needs and goals of the organization.
In conclusion, the 7 QC tools offer a comprehensive approach to problem-solving and quality improvement. They are data-driven, cost-effective, and provide a systematic approach to quality management. By using these tools, organizations can reduce costs, increase productivity, and improve customer satisfaction. However, it is important to select the right tool for the problem at hand, and to understand the strengths and limitations of each tool. The 7 QC tools have a rich history and have become an integral part of Lean and Six Sigma methodologies, making them an essential tool for any organization that wants to improve the quality of its products or services.
References:
Goetsch, D. L., & Davis, S. B. (2014). Quality management for organizational excellence. Upper Saddle River, NJ: Pearson.
Ishikawa, K. (1985). What is Total Quality Control? The Japanese Way. Englewood Cliffs, NJ: Prentice Hall.
Batch vs. One Piece Flow Manufacturing: Which Is Right For Your Business?
Maximizing Quality And Efficiency: The Power Of Design For Six Sigma (DFSS)
Leave a Comment Cancel reply
Save my name, email, and website in this browser for the next time I comment.
Reach out to us
Our proven process equips individuals with proven method and skills to create positive change and improve efficiency while reducing errors
© 2024 leansixsigmamadeeasy.com
7 Step QC Story Workshop
Learning objectives:.
To help Process & Engineering Managers to appreciate the principles & concept of 7 step QC Story approach for problem solving and how to can be applied to different problems
Expected Outcomes:
- Understand the concept of QC story and steps involved and how it can be used to solve problems
- Learn the tools and techniques that are used as a part of QC story problem solving approach
- Step by step process applying QC Story approach for different scenarios
- Practical strategies to manage problem solving teams
Target Audience:
Engineering Leadership Team, Manufacturing Managers, Supply Chain Managers, Quality Engineers, Process Improvement Professionals
One day interactive workshop
Broad Curriculum:
Broad scope is include here:
- 7 step QC approach and its benefits
- Linkage to Lean principles, Policy, DWM and PDCA
- Step-by-step hands-on training on QC Story tools & techniques
- Problem statement
- Process Flow Diagram
- Cause & Effect Analysis
- Data & Graphical Analysis Tools
- 5Why analysis
- Decision Matrix
- Brainstorming
- Pilot Planning & Results
- Mistake Proofing
- Control Plan & link to DWM
- Standard Work
- Control Charts
- Recognizing Team Efforts
All the methods to be covered in the training will be Application, Analysis or Synthesis as per Bloom’s taxonomy.
Aimed at encouraging exploratory learning, in this this workshop a full-fledged case study will be provided that the team will workshop from start to finish covering all the aspects covered above followed by facilitated group discussions to understand the QC Story principles & tools.
To conduct QC Story workshop in Chennai, Bangalore, Mumbai, Delhi and across India and to know more about the curriculum & structure & customization to your needs, contact us .
Sign-up for collaborat newsletter
Where We Can Help
- Client Centricity & Value Creation
- Sales Transformation
- Experience Design
- Enterprise Agility
- Data & Analytics
- Quality & Productivity Improvement
How We Can Help
- Strategic Workshops
- Implementation & Co-creation
- Training & Mentoring
- Client Research
- Data based Insights
- [email protected]
- +91-9176615766

Streamlining Six Sigma Projects with The 7 QC Tools
Updated: September 26, 2023 by Ken Feldman
As in any tool chest, you can have dozens, if not hundreds, of different tools for all types of specialized tasks. Such is the case with Six Sigma. There are many tools available for your use depending on what you want to accomplish. However, like your home tool chest, there are a small set of basic tools that are your go-to tools you will use most often and on most projects.
Let’s review the 7 QC tools that are most commonly used in Six Sigma , the benefits of those tools, and some best practices for using them.
Overview: What are the 7 QC tools?
It is believed that the 7 QC tools were introduced by Kaoru Ishikawa in postwar Japan, inspired by the seven famous weapons of Benkei. Benkei was a Japanese warrior monk who armed himself with seven weapons and was on a personal quest to take 1,000 swords from samurai warriors who he believed were arrogant and unworthy.
Ishikawa was influenced by a series of lectures on statistical quality control given by Dr. W. Edwards Deming in 1950 to a group of Japanese scientists and engineers. Unfortunately, the complexity of the subject intimidated most workers, so Ishikawa focused primarily on a reduced set of tools that would suffice for most quality-related issues.
The 7 QC tools are:
- Check sheet
- Fishbone diagram (cause and effect diagram, or Ishikawa diagram)
- Pareto chart
- Control chart
- Scatter diagram
- Stratification
Let’s explore each in a little more detail.
Check sheet: A form to collect and tally data for further analysis.
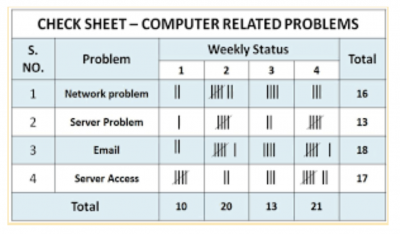
Image source: techqualitypedia.com .
Fishbone diagram: Fishbone diagrams are used to drill down to find the root cause of a problem. As the name implies, the diagram looks like the bones of a fish, where each main bone represents a specific category of possible root cause, and the subsequent drilling down is shown as smaller and smaller bones.
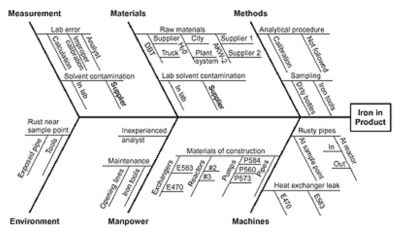
Image source: asq.org .
Histogram: This is a bar graph showing the frequency of a set of data, usually continuous data. The histogram allows you to see the center of the data, the range of the data, and the distribution of the data. It is a very useful snapshot. The downside is that you can’t see the sequence or order of the data.
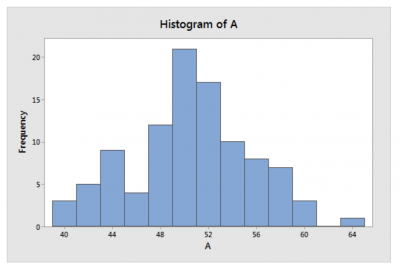
Image source: statisticsbyjim.com .
Pareto chart: This chart is based on the 80/20 principle that says 80% of your effect is caused by 20% of your causes. For example, 80% of your sales comes from 20% of your customers. Dr. Joseph Juran, who developed this chart, often referred to this principle as the vital few and trivial many . He later revised that to the vital few and useful many . The Pareto chart lists the causes in descending order of frequency or magnitude. It is used to prioritize what you should look at first to improve your process.
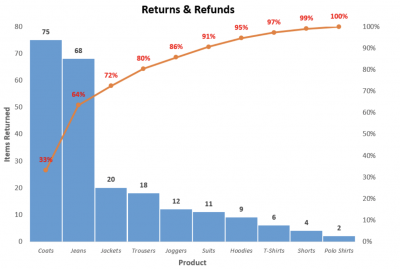
Image source: www.automateexcel.com .
Control chart: A control chart is a statistical tool that looks at your process data over time for the purpose of distinguishing between special cause and common cause variation.
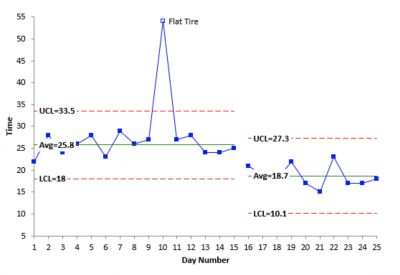
Image source: www.spcforexcel.com .
Scatter diagram: These are also known as scatter plots. They’re used to show a graphical correlation between a set of paired data on an X and Y axis. It is the graphical representation of what you would use for regression analysis.
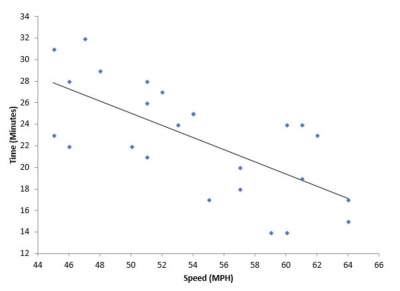
Image source: www.spcforexcel.com .
Stratification: This is a graph that shows data that has been stratified when the data comes from different sources. It is useful to view the data by certain strata such as shift, gender, geographic location, machines, or suppliers.
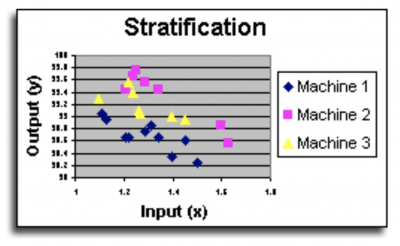
Image source: www.systems2win.com .
3 benefits of the 7 QC tools
These seven tools are easy to understand and apply and will help you understand what is going on in your process.
1. Easy
These 7 QC tools are easy to understand and implement yet powerful in identifying root causes, in discriminating between types of variation, and as a visual description of your data. A picture is truly worth 10,000 words (or statistical calculations).
2. Software-driven
Gone are the days when you had to draw all of your graphs by hand. There are many simple and cost-effective software packages that will take your data and quickly produce graphs.
3. 80/20
The Pareto principle applies to the 7 QC tools as well. 80% of your quality issues can be addressed by using 20% of the most common tools.
Why are the 7 QC tools important to understand?
The key thing to understand is when to use each tool — which one is appropriate for your specific situation?
Tools address different issues
The more familiar you are with these common tools, the quicker you’ll be able to select the right one to help you solve your problem or answer your question. The Fishbone diagram is used to search for root causes of your problem. A control chart is used to distinguish between common and special cause variation. A scatter diagram is used to look for correlation or relationship between an X and Y variable.
Graphs don’t tell the whole story
Graphs and diagrams are useful for providing an overview and directional indicator of your process, but statistical analysis will provide greater confidence than a graph alone.
Flexibility
These seven tools can be used for different types of data and across any type of function. Their flexibility makes them useful in myriad situations and industries, so becoming familiar with them can be a wise investment.
3 best practices when thinking about the 7 QC tools
Use these tools for as many applications as is feasible. Keep it simple, and only use the more sophisticated and complex tools if you need the additional information and analysis.
1. Have a clear idea of what question you’re trying to answer
Since each of the tools can be used to answer different data and process questions, be sure you’ve clearly defined the question you’re trying to answer.
2. Use them as your primary presentation
Use the 7 QC tools and their accompanying graphs and diagrams as your primary presentation format. Reserve the statistical analysis for questions that go beyond what’s answered in the graphs.
3. Make sure they’re self-explanatory
Be sure your graphs are succinct and self-explanatory so people can understand what you’re trying to tell them without the need for a long-winded explanation.
Frequently Asked Questions (FAQ) about the 7 QC tools
What is meant by stratification .
If you collected production data throughout the day across all three shifts and five machines, you might want to stratify or separate your data and look at it by shift and by machine. This would allow you to understand whether there were any differences between the strata. This might indicate the source of a root cause or an opportunity to improve the other shifts if one is found to be doing better than the others.
What are the 7 basic QC tools?
Scatter diagrams, Pareto charts, control charts, histograms, stratification, fishbone diagrams and check sheets.
Do I have to draw the graphs and diagrams for the 7 QC tools by hand?
With the use of current software and computer technology, you will rarely be required to create the graphs by hand. Still, it might be interesting to do it by hand once to fully appreciate the tools and software available to us.
Let’s review what’s in your tool belt
The 7 QC tools are basic graphical representations of your data. They can be used to answer a wide variety of questions about your data and your process. Use them as your primary presentation format when talking about what your data is telling you. While they are not a complete list of tools, they should be robust enough to address many of your improvement issues.
The 7 QC tools, while basic, are foundational to the Six Sigma methodology and have stood the test of time. Their simplicity and versatility make them indispensable for professionals across industries. As businesses evolve and data becomes more integral to decision-making, the importance of these tools only grows. They bridge the gap between raw data and actionable insights, allowing teams to make informed decisions. Moreover, in today’s digital age, with the integration of AI and machine learning, these tools can be further enhanced to provide even deeper insights. However, the essence remains the same: understanding and improving processes through data visualization.
Key Points About The 7 QC Tools:
Origin and Influence: Introduced by Kaoru Ishikawa, inspired by Benkei’s seven weapons and influenced by Dr. W. Edwards Deming’s lectures on statistical quality control.
List of 7 QC Tools: Check sheet, Fishbone diagram, Histogram, Pareto chart, Control chart, Scatter diagram, and Stratification.
Benefits: These tools are easy to understand, software-driven, and adhere to the 80/20 principle, addressing 80% of quality issues with 20% of the most common tools.
Importance: They address different issues, provide an overview of processes, and offer flexibility across data types and functions.
Best Practices: Clearly define the question, use the tools as the primary presentation format, and ensure graphs are self-explanatory.
About the Author

Ken Feldman

- All courses
Productivity
7 qc tools for quality improvement.

*Optional training delivery method for this course: Remote Online Training (ROT) or Face-to-Face (F2F) !

COURSE DESCRIPTION
7 QC Tools For Quality Improvement course provides an in-depth study of the 7 Basic QC (Quality Control) Tools. They are scientific management tools, used worldwide by almost every organizations to collect and analyze data/facts for the purpose of quality improvements. The 7 QC Tools are simple tools, low-cost and easy-to-use; but they are powerful tools that forms the critical foundation for all problem solving and quality improvement activities. Once mastered, these tools will serve as the solid foundation for individuals’ and team’s root cause analyses, problem solving sessions, and continuous improvement projects.
Manufacturing and service industry professionals, quality technicians and auditors, and industrial engineers will all benefit from understanding these tools. In addition to the foundational principles and concepts, this training examines practical real-world applications of the 7 QC Tools in the workplace. Participants will be provided with value-added MS Excel templates. These templates will help construct those QC Tools fast, easy and accurately.
This course is a MUST for all Quality Assurance staff such as Quality Engineers, Technicians, QC Leaders and also serve as a foundational course for Data Analysis & Lean Six Sigma practitioners.
CERTIFICATION
No certification.
Certificate of Achievement (for those who scored 80% and above for post-test) or Certificate of Attendance.
LEARNING OUTCOMES
At the end of the course, participants will be able to:
- Describe the benefits and power of each of the 7 QC Tools and its applications.
- Construct the QC tools accurately and fast using Microsoft Excel templates.
- Interpret , analyze and make accurate quality improvement decisions using the correct tools
- Perform data analysis and process monitoring using the QC tools
- Solve problems systematically and effectively.
- Experience the Quality Control Circle (QCC) team dynamics in solving problems.
- Make convincing presentations with the data collected from their workplace.
COURSE OUTLINE
Please see eBrochure above for more information.
To register, please Whatsapp : +60-19-502 2718 or email us at [email protected]
Course Features
- Skill level All level
- Language English
- Students 1632
- Assessments Yes
You May Like
Root cause analysis (rca).
Quality Control Circle (QCC) / Innovative & Creative Circle (ICC)

KAIZEN Strategies for Quality and Productivity Improvement

Measurement System Analysis (MSA)

Statistical Process Control -Level 1 (SPC1)
Modal title.
Message modal
TECHIEQUALITY
7qc tools for problem solving | what are 7 qc tools.
7QC Tools for Problem Solving techniques are generally used in manufacturing, Non-manufacturing industries, and service sectors to resolve problems.
Download 7-QC Tools Template/ Format
Definition and History:-
The 7QC Tools (Also Known as “Seven Basic Tools of Quality”) originated in Japan. First emphasized by Kaoru Ishikawa, a professor of engineering at Tokyo University and the father of “quality circles”. These tools are used to solve critical quality-related issues. You can use the 7 basic tools of quality to help understand and solve problems or defects in any industry. With the help of Excel, you can plot the graphs / Diagrams to resolve the daily quality problems. I will help you to understand the basic ideas and knowledge of 7QC Tools and their usage.
For solving problems seven QC tools are used Pareto Chart, Cause & Effect Diagram, Histogram, Control Charts, Scatter Diagrams, Graphs/Process Flow Diagram, and Check Sheets. All these tools are important tools used widely in the manufacturing field to monitor the overall operation and continuous process improvement. seven QC tools are used to find out the Root cause of the problem and implement the action plan to improve the process efficiency.
7QC tools are:-
- Pareto Chart
- Cause and effects diagram
- Scatter Diagram
- Control Chart
- Check Sheet
- PFD(Process Flow diagram)/Graphs

Benefits of 7QC Tools:-
- Improve management decisions.
- Simple and easy for implementation
- Continuous quality improvement
- Quick results
- Enhances customer satisfaction through improved quality product
- Reduce cycle time and improve efficiency
- Control cost of poor quality / Cost of quality
- Reduce defects and optimize the production
- Reduce variations and improve the quality of Products
- Encouragement of teamwork and confidence
- Enhancement of customer focus.
Pareto Chart:-
A Pareto Chart is named after the Italian Economist Vilfredo Pareto. It is a type of chart that contains both bars and a line graph, where the individual values are represented in the bar graph in descending order (largest to smallest value) and the cumulative percentage is represented in the line graph.
Click here to learn “How to Plot Pareto Chart In Excel”.
Understanding the Pareto Chart principle (The 80/20 rule):
The Pareto principle is also known as the 80/20 rule derived from the Italian Economist Vilfredo,
The principle is understood as –
20% of the input creates 80% of the results
80 % of the effects come from 20% of the causes.

In the above Pareto Chart[Figure-1], we can see the cumulative% in the line graph, According to the Pareto Chart principle 80/20 rule, the 80% cumulative in the line graph is filling under the low hardness, which means BH, Damage, SH and Low hardness defers are coving the 80% of contribution over total types of defects. And those 80 % of contributions were due to the 20% caused.
Histogram:-
The histogram is one of the 7QC tools, which is the most commonly used graph to show frequency distribution.
Helps summarize data from a process that has been collected over a period of time.
Click here to know the “How to Plot Histogram in Excel:

Fish-bone Diagram/Cause and Effects /Ishikawa Diagram:-
The cause and Effects Diagram looks like a fish that’s why it’s called Fish-bone Diagram, also called the Ishikawa diagram.
It’s a visualization tool for categorizing the potential causes of a problem in order to identify its root causes.
CFT members are identifying the potential cause through the Brainstorming process of individuals and together.
The Potential cause is related w.r.t below as
- Environment
- Measurement

Scatter diagram:-
The scatter diagram graphs pairs of variable data, with one variable on each axis, to look for a relationship between them. If the variables correlate, the points will fall along a line or curve. The better the correlation, the more points will strongly cluster to the line. It generally gives the idea of the correlation between the variables.

In the above figure-4, the positive and Negative correlation is only due to the direction, and in both the correlation, points are clustered to the line but in the last figure in figure-4, Points are not clustered to the line but spread over the X and Y-axis.
Control Chart:-
A line on a control chart is used as a basis for judging the stability of a process. If the observed points are beyond a control limit then it is evidence that special causes are affecting the process.
Control Charts can be used to monitor or evaluate a process.
There are basically two types of control charts, those for variable data and those for attributes data.
Click here to learn more about the Control Chart and Statistical Process Control.
Benefits: -Higher Quality, Lower Unit Cost, Higher effective Capability, etc.
Selection of Control Charts based on Attribute / Variable Type Data:-

Calculation of Average and Range Charts-
Click here to know the details.
The formula of the Attributes Control Chart:-
Click here to learn the formula and calculation.
Nomenclature of Control Chart:-

Check Sheet:-
Check Sheet is a simple document used for collecting data in real time. Variable or Attribute type data is collected through a Check sheet. A check sheet generally helps to make the decision on the basis of a fact and to collect the data for analysis and evaluation.
Sample check Sheet:-
Process Flow diagram/Graphs:-
A process flow diagram is a diagram used to indicate the general flow of plant processes and equipment.

The 7QC tools are the most commonly used tool in the industry for improvement, With the help of the 7QC tools you can understand the process/activities, analyze the data, and interpret the result/graph/output.
Which are the 7 QC tools?
The seven QC tools are
- Fishbone diagram
- PFD(Process Flow diagram)/Graphs /Stratification
Useful Article:
why why analysis methodology | 5-why analysis step by step guide
Rework vs Repair |IATF Requirement for Control of Reworked/ Repaired Product
How to plot the Run Chart in Minitab
Run Chart Example | Concept & Interpretation of Result with Case Study | Industrial Example:
Thank you for reading..keep visiting Techiequality.Com
I hope the above article “7QC Tools for Problem Solving” is useful to you…
Popular Post:
Related Posts

The Author is an Expert in Quality Management System, Operation Management, Business Excellence, Process Excellence, IATF 16949, ISO 9001, ISO 14001, ISO 45001, ISO 17025, TQM, TPM & QA. He is Certified as an IA for ISO 9001, IATF 16949, ISO 14001, ISO 17025 & ISO 45001 Standard.
Your email address will not be published. Required fields are marked *
Email Address: *
Save my name, email, and website in this browser for the next time I comment.
How to master the seven-step problem-solving process
In this episode of the McKinsey Podcast , Simon London speaks with Charles Conn, CEO of venture-capital firm Oxford Sciences Innovation, and McKinsey senior partner Hugo Sarrazin about the complexities of different problem-solving strategies.
Podcast transcript
Simon London: Hello, and welcome to this episode of the McKinsey Podcast , with me, Simon London. What’s the number-one skill you need to succeed professionally? Salesmanship, perhaps? Or a facility with statistics? Or maybe the ability to communicate crisply and clearly? Many would argue that at the very top of the list comes problem solving: that is, the ability to think through and come up with an optimal course of action to address any complex challenge—in business, in public policy, or indeed in life.
Looked at this way, it’s no surprise that McKinsey takes problem solving very seriously, testing for it during the recruiting process and then honing it, in McKinsey consultants, through immersion in a structured seven-step method. To discuss the art of problem solving, I sat down in California with McKinsey senior partner Hugo Sarrazin and also with Charles Conn. Charles is a former McKinsey partner, entrepreneur, executive, and coauthor of the book Bulletproof Problem Solving: The One Skill That Changes Everything [John Wiley & Sons, 2018].
Charles and Hugo, welcome to the podcast. Thank you for being here.
Hugo Sarrazin: Our pleasure.
Charles Conn: It’s terrific to be here.
Simon London: Problem solving is a really interesting piece of terminology. It could mean so many different things. I have a son who’s a teenage climber. They talk about solving problems. Climbing is problem solving. Charles, when you talk about problem solving, what are you talking about?
Charles Conn: For me, problem solving is the answer to the question “What should I do?” It’s interesting when there’s uncertainty and complexity, and when it’s meaningful because there are consequences. Your son’s climbing is a perfect example. There are consequences, and it’s complicated, and there’s uncertainty—can he make that grab? I think we can apply that same frame almost at any level. You can think about questions like “What town would I like to live in?” or “Should I put solar panels on my roof?”
You might think that’s a funny thing to apply problem solving to, but in my mind it’s not fundamentally different from business problem solving, which answers the question “What should my strategy be?” Or problem solving at the policy level: “How do we combat climate change?” “Should I support the local school bond?” I think these are all part and parcel of the same type of question, “What should I do?”
I’m a big fan of structured problem solving. By following steps, we can more clearly understand what problem it is we’re solving, what are the components of the problem that we’re solving, which components are the most important ones for us to pay attention to, which analytic techniques we should apply to those, and how we can synthesize what we’ve learned back into a compelling story. That’s all it is, at its heart.
I think sometimes when people think about seven steps, they assume that there’s a rigidity to this. That’s not it at all. It’s actually to give you the scope for creativity, which often doesn’t exist when your problem solving is muddled.
Simon London: You were just talking about the seven-step process. That’s what’s written down in the book, but it’s a very McKinsey process as well. Without getting too deep into the weeds, let’s go through the steps, one by one. You were just talking about problem definition as being a particularly important thing to get right first. That’s the first step. Hugo, tell us about that.
Hugo Sarrazin: It is surprising how often people jump past this step and make a bunch of assumptions. The most powerful thing is to step back and ask the basic questions—“What are we trying to solve? What are the constraints that exist? What are the dependencies?” Let’s make those explicit and really push the thinking and defining. At McKinsey, we spend an enormous amount of time in writing that little statement, and the statement, if you’re a logic purist, is great. You debate. “Is it an ‘or’? Is it an ‘and’? What’s the action verb?” Because all these specific words help you get to the heart of what matters.
Want to subscribe to The McKinsey Podcast ?
Simon London: So this is a concise problem statement.
Hugo Sarrazin: Yeah. It’s not like “Can we grow in Japan?” That’s interesting, but it is “What, specifically, are we trying to uncover in the growth of a product in Japan? Or a segment in Japan? Or a channel in Japan?” When you spend an enormous amount of time, in the first meeting of the different stakeholders, debating this and having different people put forward what they think the problem definition is, you realize that people have completely different views of why they’re here. That, to me, is the most important step.
Charles Conn: I would agree with that. For me, the problem context is critical. When we understand “What are the forces acting upon your decision maker? How quickly is the answer needed? With what precision is the answer needed? Are there areas that are off limits or areas where we would particularly like to find our solution? Is the decision maker open to exploring other areas?” then you not only become more efficient, and move toward what we call the critical path in problem solving, but you also make it so much more likely that you’re not going to waste your time or your decision maker’s time.
How often do especially bright young people run off with half of the idea about what the problem is and start collecting data and start building models—only to discover that they’ve really gone off half-cocked.
Hugo Sarrazin: Yeah.
Charles Conn: And in the wrong direction.
Simon London: OK. So step one—and there is a real art and a structure to it—is define the problem. Step two, Charles?
Charles Conn: My favorite step is step two, which is to use logic trees to disaggregate the problem. Every problem we’re solving has some complexity and some uncertainty in it. The only way that we can really get our team working on the problem is to take the problem apart into logical pieces.
What we find, of course, is that the way to disaggregate the problem often gives you an insight into the answer to the problem quite quickly. I love to do two or three different cuts at it, each one giving a bit of a different insight into what might be going wrong. By doing sensible disaggregations, using logic trees, we can figure out which parts of the problem we should be looking at, and we can assign those different parts to team members.
Simon London: What’s a good example of a logic tree on a sort of ratable problem?
Charles Conn: Maybe the easiest one is the classic profit tree. Almost in every business that I would take a look at, I would start with a profit or return-on-assets tree. In its simplest form, you have the components of revenue, which are price and quantity, and the components of cost, which are cost and quantity. Each of those can be broken out. Cost can be broken into variable cost and fixed cost. The components of price can be broken into what your pricing scheme is. That simple tree often provides insight into what’s going on in a business or what the difference is between that business and the competitors.
If we add the leg, which is “What’s the asset base or investment element?”—so profit divided by assets—then we can ask the question “Is the business using its investments sensibly?” whether that’s in stores or in manufacturing or in transportation assets. I hope we can see just how simple this is, even though we’re describing it in words.
When I went to work with Gordon Moore at the Moore Foundation, the problem that he asked us to look at was “How can we save Pacific salmon?” Now, that sounds like an impossible question, but it was amenable to precisely the same type of disaggregation and allowed us to organize what became a 15-year effort to improve the likelihood of good outcomes for Pacific salmon.
Simon London: Now, is there a danger that your logic tree can be impossibly large? This, I think, brings us onto the third step in the process, which is that you have to prioritize.
Charles Conn: Absolutely. The third step, which we also emphasize, along with good problem definition, is rigorous prioritization—we ask the questions “How important is this lever or this branch of the tree in the overall outcome that we seek to achieve? How much can I move that lever?” Obviously, we try and focus our efforts on ones that have a big impact on the problem and the ones that we have the ability to change. With salmon, ocean conditions turned out to be a big lever, but not one that we could adjust. We focused our attention on fish habitats and fish-harvesting practices, which were big levers that we could affect.
People spend a lot of time arguing about branches that are either not important or that none of us can change. We see it in the public square. When we deal with questions at the policy level—“Should you support the death penalty?” “How do we affect climate change?” “How can we uncover the causes and address homelessness?”—it’s even more important that we’re focusing on levers that are big and movable.
Would you like to learn more about our Strategy & Corporate Finance Practice ?
Simon London: Let’s move swiftly on to step four. You’ve defined your problem, you disaggregate it, you prioritize where you want to analyze—what you want to really look at hard. Then you got to the work plan. Now, what does that mean in practice?
Hugo Sarrazin: Depending on what you’ve prioritized, there are many things you could do. It could be breaking the work among the team members so that people have a clear piece of the work to do. It could be defining the specific analyses that need to get done and executed, and being clear on time lines. There’s always a level-one answer, there’s a level-two answer, there’s a level-three answer. Without being too flippant, I can solve any problem during a good dinner with wine. It won’t have a whole lot of backing.
Simon London: Not going to have a lot of depth to it.
Hugo Sarrazin: No, but it may be useful as a starting point. If the stakes are not that high, that could be OK. If it’s really high stakes, you may need level three and have the whole model validated in three different ways. You need to find a work plan that reflects the level of precision, the time frame you have, and the stakeholders you need to bring along in the exercise.
Charles Conn: I love the way you’ve described that, because, again, some people think of problem solving as a linear thing, but of course what’s critical is that it’s iterative. As you say, you can solve the problem in one day or even one hour.
Charles Conn: We encourage our teams everywhere to do that. We call it the one-day answer or the one-hour answer. In work planning, we’re always iterating. Every time you see a 50-page work plan that stretches out to three months, you know it’s wrong. It will be outmoded very quickly by that learning process that you described. Iterative problem solving is a critical part of this. Sometimes, people think work planning sounds dull, but it isn’t. It’s how we know what’s expected of us and when we need to deliver it and how we’re progressing toward the answer. It’s also the place where we can deal with biases. Bias is a feature of every human decision-making process. If we design our team interactions intelligently, we can avoid the worst sort of biases.
Simon London: Here we’re talking about cognitive biases primarily, right? It’s not that I’m biased against you because of your accent or something. These are the cognitive biases that behavioral sciences have shown we all carry around, things like anchoring, overoptimism—these kinds of things.
Both: Yeah.
Charles Conn: Availability bias is the one that I’m always alert to. You think you’ve seen the problem before, and therefore what’s available is your previous conception of it—and we have to be most careful about that. In any human setting, we also have to be careful about biases that are based on hierarchies, sometimes called sunflower bias. I’m sure, Hugo, with your teams, you make sure that the youngest team members speak first. Not the oldest team members, because it’s easy for people to look at who’s senior and alter their own creative approaches.
Hugo Sarrazin: It’s helpful, at that moment—if someone is asserting a point of view—to ask the question “This was true in what context?” You’re trying to apply something that worked in one context to a different one. That can be deadly if the context has changed, and that’s why organizations struggle to change. You promote all these people because they did something that worked well in the past, and then there’s a disruption in the industry, and they keep doing what got them promoted even though the context has changed.
Simon London: Right. Right.
Hugo Sarrazin: So it’s the same thing in problem solving.
Charles Conn: And it’s why diversity in our teams is so important. It’s one of the best things about the world that we’re in now. We’re likely to have people from different socioeconomic, ethnic, and national backgrounds, each of whom sees problems from a slightly different perspective. It is therefore much more likely that the team will uncover a truly creative and clever approach to problem solving.
Simon London: Let’s move on to step five. You’ve done your work plan. Now you’ve actually got to do the analysis. The thing that strikes me here is that the range of tools that we have at our disposal now, of course, is just huge, particularly with advances in computation, advanced analytics. There’s so many things that you can apply here. Just talk about the analysis stage. How do you pick the right tools?
Charles Conn: For me, the most important thing is that we start with simple heuristics and explanatory statistics before we go off and use the big-gun tools. We need to understand the shape and scope of our problem before we start applying these massive and complex analytical approaches.
Simon London: Would you agree with that?
Hugo Sarrazin: I agree. I think there are so many wonderful heuristics. You need to start there before you go deep into the modeling exercise. There’s an interesting dynamic that’s happening, though. In some cases, for some types of problems, it is even better to set yourself up to maximize your learning. Your problem-solving methodology is test and learn, test and learn, test and learn, and iterate. That is a heuristic in itself, the A/B testing that is used in many parts of the world. So that’s a problem-solving methodology. It’s nothing different. It just uses technology and feedback loops in a fast way. The other one is exploratory data analysis. When you’re dealing with a large-scale problem, and there’s so much data, I can get to the heuristics that Charles was talking about through very clever visualization of data.
You test with your data. You need to set up an environment to do so, but don’t get caught up in neural-network modeling immediately. You’re testing, you’re checking—“Is the data right? Is it sound? Does it make sense?”—before you launch too far.
Simon London: You do hear these ideas—that if you have a big enough data set and enough algorithms, they’re going to find things that you just wouldn’t have spotted, find solutions that maybe you wouldn’t have thought of. Does machine learning sort of revolutionize the problem-solving process? Or are these actually just other tools in the toolbox for structured problem solving?
Charles Conn: It can be revolutionary. There are some areas in which the pattern recognition of large data sets and good algorithms can help us see things that we otherwise couldn’t see. But I do think it’s terribly important we don’t think that this particular technique is a substitute for superb problem solving, starting with good problem definition. Many people use machine learning without understanding algorithms that themselves can have biases built into them. Just as 20 years ago, when we were doing statistical analysis, we knew that we needed good model definition, we still need a good understanding of our algorithms and really good problem definition before we launch off into big data sets and unknown algorithms.
Simon London: Step six. You’ve done your analysis.
Charles Conn: I take six and seven together, and this is the place where young problem solvers often make a mistake. They’ve got their analysis, and they assume that’s the answer, and of course it isn’t the answer. The ability to synthesize the pieces that came out of the analysis and begin to weave those into a story that helps people answer the question “What should I do?” This is back to where we started. If we can’t synthesize, and we can’t tell a story, then our decision maker can’t find the answer to “What should I do?”
Simon London: But, again, these final steps are about motivating people to action, right?
Charles Conn: Yeah.
Simon London: I am slightly torn about the nomenclature of problem solving because it’s on paper, right? Until you motivate people to action, you actually haven’t solved anything.
Charles Conn: I love this question because I think decision-making theory, without a bias to action, is a waste of time. Everything in how I approach this is to help people take action that makes the world better.
Simon London: Hence, these are absolutely critical steps. If you don’t do this well, you’ve just got a bunch of analysis.
Charles Conn: We end up in exactly the same place where we started, which is people speaking across each other, past each other in the public square, rather than actually working together, shoulder to shoulder, to crack these important problems.
Simon London: In the real world, we have a lot of uncertainty—arguably, increasing uncertainty. How do good problem solvers deal with that?
Hugo Sarrazin: At every step of the process. In the problem definition, when you’re defining the context, you need to understand those sources of uncertainty and whether they’re important or not important. It becomes important in the definition of the tree.
You need to think carefully about the branches of the tree that are more certain and less certain as you define them. They don’t have equal weight just because they’ve got equal space on the page. Then, when you’re prioritizing, your prioritization approach may put more emphasis on things that have low probability but huge impact—or, vice versa, may put a lot of priority on things that are very likely and, hopefully, have a reasonable impact. You can introduce that along the way. When you come back to the synthesis, you just need to be nuanced about what you’re understanding, the likelihood.
Often, people lack humility in the way they make their recommendations: “This is the answer.” They’re very precise, and I think we would all be well-served to say, “This is a likely answer under the following sets of conditions” and then make the level of uncertainty clearer, if that is appropriate. It doesn’t mean you’re always in the gray zone; it doesn’t mean you don’t have a point of view. It just means that you can be explicit about the certainty of your answer when you make that recommendation.
Simon London: So it sounds like there is an underlying principle: “Acknowledge and embrace the uncertainty. Don’t pretend that it isn’t there. Be very clear about what the uncertainties are up front, and then build that into every step of the process.”
Hugo Sarrazin: Every step of the process.
Simon London: Yeah. We have just walked through a particular structured methodology for problem solving. But, of course, this is not the only structured methodology for problem solving. One that is also very well-known is design thinking, which comes at things very differently. So, Hugo, I know you have worked with a lot of designers. Just give us a very quick summary. Design thinking—what is it, and how does it relate?
Hugo Sarrazin: It starts with an incredible amount of empathy for the user and uses that to define the problem. It does pause and go out in the wild and spend an enormous amount of time seeing how people interact with objects, seeing the experience they’re getting, seeing the pain points or joy—and uses that to infer and define the problem.
Simon London: Problem definition, but out in the world.
Hugo Sarrazin: With an enormous amount of empathy. There’s a huge emphasis on empathy. Traditional, more classic problem solving is you define the problem based on an understanding of the situation. This one almost presupposes that we don’t know the problem until we go see it. The second thing is you need to come up with multiple scenarios or answers or ideas or concepts, and there’s a lot of divergent thinking initially. That’s slightly different, versus the prioritization, but not for long. Eventually, you need to kind of say, “OK, I’m going to converge again.” Then you go and you bring things back to the customer and get feedback and iterate. Then you rinse and repeat, rinse and repeat. There’s a lot of tactile building, along the way, of prototypes and things like that. It’s very iterative.
Simon London: So, Charles, are these complements or are these alternatives?
Charles Conn: I think they’re entirely complementary, and I think Hugo’s description is perfect. When we do problem definition well in classic problem solving, we are demonstrating the kind of empathy, at the very beginning of our problem, that design thinking asks us to approach. When we ideate—and that’s very similar to the disaggregation, prioritization, and work-planning steps—we do precisely the same thing, and often we use contrasting teams, so that we do have divergent thinking. The best teams allow divergent thinking to bump them off whatever their initial biases in problem solving are. For me, design thinking gives us a constant reminder of creativity, empathy, and the tactile nature of problem solving, but it’s absolutely complementary, not alternative.
Simon London: I think, in a world of cross-functional teams, an interesting question is do people with design-thinking backgrounds really work well together with classical problem solvers? How do you make that chemistry happen?
Hugo Sarrazin: Yeah, it is not easy when people have spent an enormous amount of time seeped in design thinking or user-centric design, whichever word you want to use. If the person who’s applying classic problem-solving methodology is very rigid and mechanical in the way they’re doing it, there could be an enormous amount of tension. If there’s not clarity in the role and not clarity in the process, I think having the two together can be, sometimes, problematic.
The second thing that happens often is that the artifacts the two methodologies try to gravitate toward can be different. Classic problem solving often gravitates toward a model; design thinking migrates toward a prototype. Rather than writing a big deck with all my supporting evidence, they’ll bring an example, a thing, and that feels different. Then you spend your time differently to achieve those two end products, so that’s another source of friction.
Now, I still think it can be an incredibly powerful thing to have the two—if there are the right people with the right mind-set, if there is a team that is explicit about the roles, if we’re clear about the kind of outcomes we are attempting to bring forward. There’s an enormous amount of collaborativeness and respect.
Simon London: But they have to respect each other’s methodology and be prepared to flex, maybe, a little bit, in how this process is going to work.
Hugo Sarrazin: Absolutely.
Simon London: The other area where, it strikes me, there could be a little bit of a different sort of friction is this whole concept of the day-one answer, which is what we were just talking about in classical problem solving. Now, you know that this is probably not going to be your final answer, but that’s how you begin to structure the problem. Whereas I would imagine your design thinkers—no, they’re going off to do their ethnographic research and get out into the field, potentially for a long time, before they come back with at least an initial hypothesis.

Want better strategies? Become a bulletproof problem solver
Hugo Sarrazin: That is a great callout, and that’s another difference. Designers typically will like to soak into the situation and avoid converging too quickly. There’s optionality and exploring different options. There’s a strong belief that keeps the solution space wide enough that you can come up with more radical ideas. If there’s a large design team or many designers on the team, and you come on Friday and say, “What’s our week-one answer?” they’re going to struggle. They’re not going to be comfortable, naturally, to give that answer. It doesn’t mean they don’t have an answer; it’s just not where they are in their thinking process.
Simon London: I think we are, sadly, out of time for today. But Charles and Hugo, thank you so much.
Charles Conn: It was a pleasure to be here, Simon.
Hugo Sarrazin: It was a pleasure. Thank you.
Simon London: And thanks, as always, to you, our listeners, for tuning into this episode of the McKinsey Podcast . If you want to learn more about problem solving, you can find the book, Bulletproof Problem Solving: The One Skill That Changes Everything , online or order it through your local bookstore. To learn more about McKinsey, you can of course find us at McKinsey.com.
Charles Conn is CEO of Oxford Sciences Innovation and an alumnus of McKinsey’s Sydney office. Hugo Sarrazin is a senior partner in the Silicon Valley office, where Simon London, a member of McKinsey Publishing, is also based.
Explore a career with us
Related articles.

Strategy to beat the odds

Five routes to more innovative problem solving
Quick Skill Quality (Training for Technician)
My dear friend, this website helps to better learning and understand about quality and improve the practical skill for those who is starting his career in QA department .
- Privacy policy
Tuesday, March 16, 2021
12 steps of quality circle | qsqtech.com.
12 STEPS OF QUALITY CIRCLE
- Identification of work related problems
- Selection of problem
- Define the problem
- Analyze the problem
- Identification of cause
- Finding out the root cause
- Data analysis
- Developing solution
- Foreseeing probable resistance
- Trial implementation
- Regular implementation
- Follow up & review
STEP-1 Identification of work related problem:
- 'A' Category Problem
- 'B' Category Problem
- 'C' Category Problem
'A' Category Problem:
'b' category problem:, 'c' category problem: , step-2 selection of problem , step-3 define the problem, step-4 analyse the problem.
- Number of times the problem occurred.
- Defect quantity
- Effect of the problem in detail.
Pareto chart:
Step-5 identification of causes , cause & effect diagram: .

STEP-6 Finding out the root cause
Step-7 data analysis , step-8 developing solution , step-9 foreseeing probable resistance , step-10 trial implementation & check performance , step-11 regular implementation , step-12 follow up & review .
- Do you know history of Quality?
- How do you know about 3M waste?
- Do you know about biography of W. Edward Deming?
- How do you know about modern development of Quality?
No comments:
Post a Comment
Clamping force | How to calculate the clamping force in injection molding machine | Qsqtech.com
CLAMPING FORCE: Clamping force is an engineering term used in mechanical and manufacturing processes. The meaning of clamping force is to ...


Master the 7-Step Problem-Solving Process for Better Decision-Making
Discover the powerful 7-Step Problem-Solving Process to make better decisions and achieve better outcomes. Master the art of problem-solving in this comprehensive guide. Download the Free PowerPoint and PDF Template.

StrategyPunk

Introduction
Mastering the art of problem-solving is crucial for making better decisions. Whether you're a student, a business owner, or an employee, problem-solving skills can help you tackle complex issues and find practical solutions. The 7-Step Problem-Solving Process is a proven method that can help you approach problems systematically and efficiently.
The 7-Step Problem-Solving Process involves steps that guide you through the problem-solving process. The first step is to define the problem, followed by disaggregating the problem into smaller, more manageable parts. Next, you prioritize the features and create a work plan to address each. Then, you analyze each piece, synthesize the information, and communicate your findings to others.
By following this process, you can avoid jumping to conclusions, overlooking important details, or making hasty decisions. Instead, you can approach problems with a clear and structured mindset, which can help you make better decisions and achieve better outcomes.
In this article, we'll explore each step of the 7-Step Problem-Solving Process in detail so you can start mastering this valuable skill. At the end of the blog post, you can download the process's free PowerPoint and PDF templates .
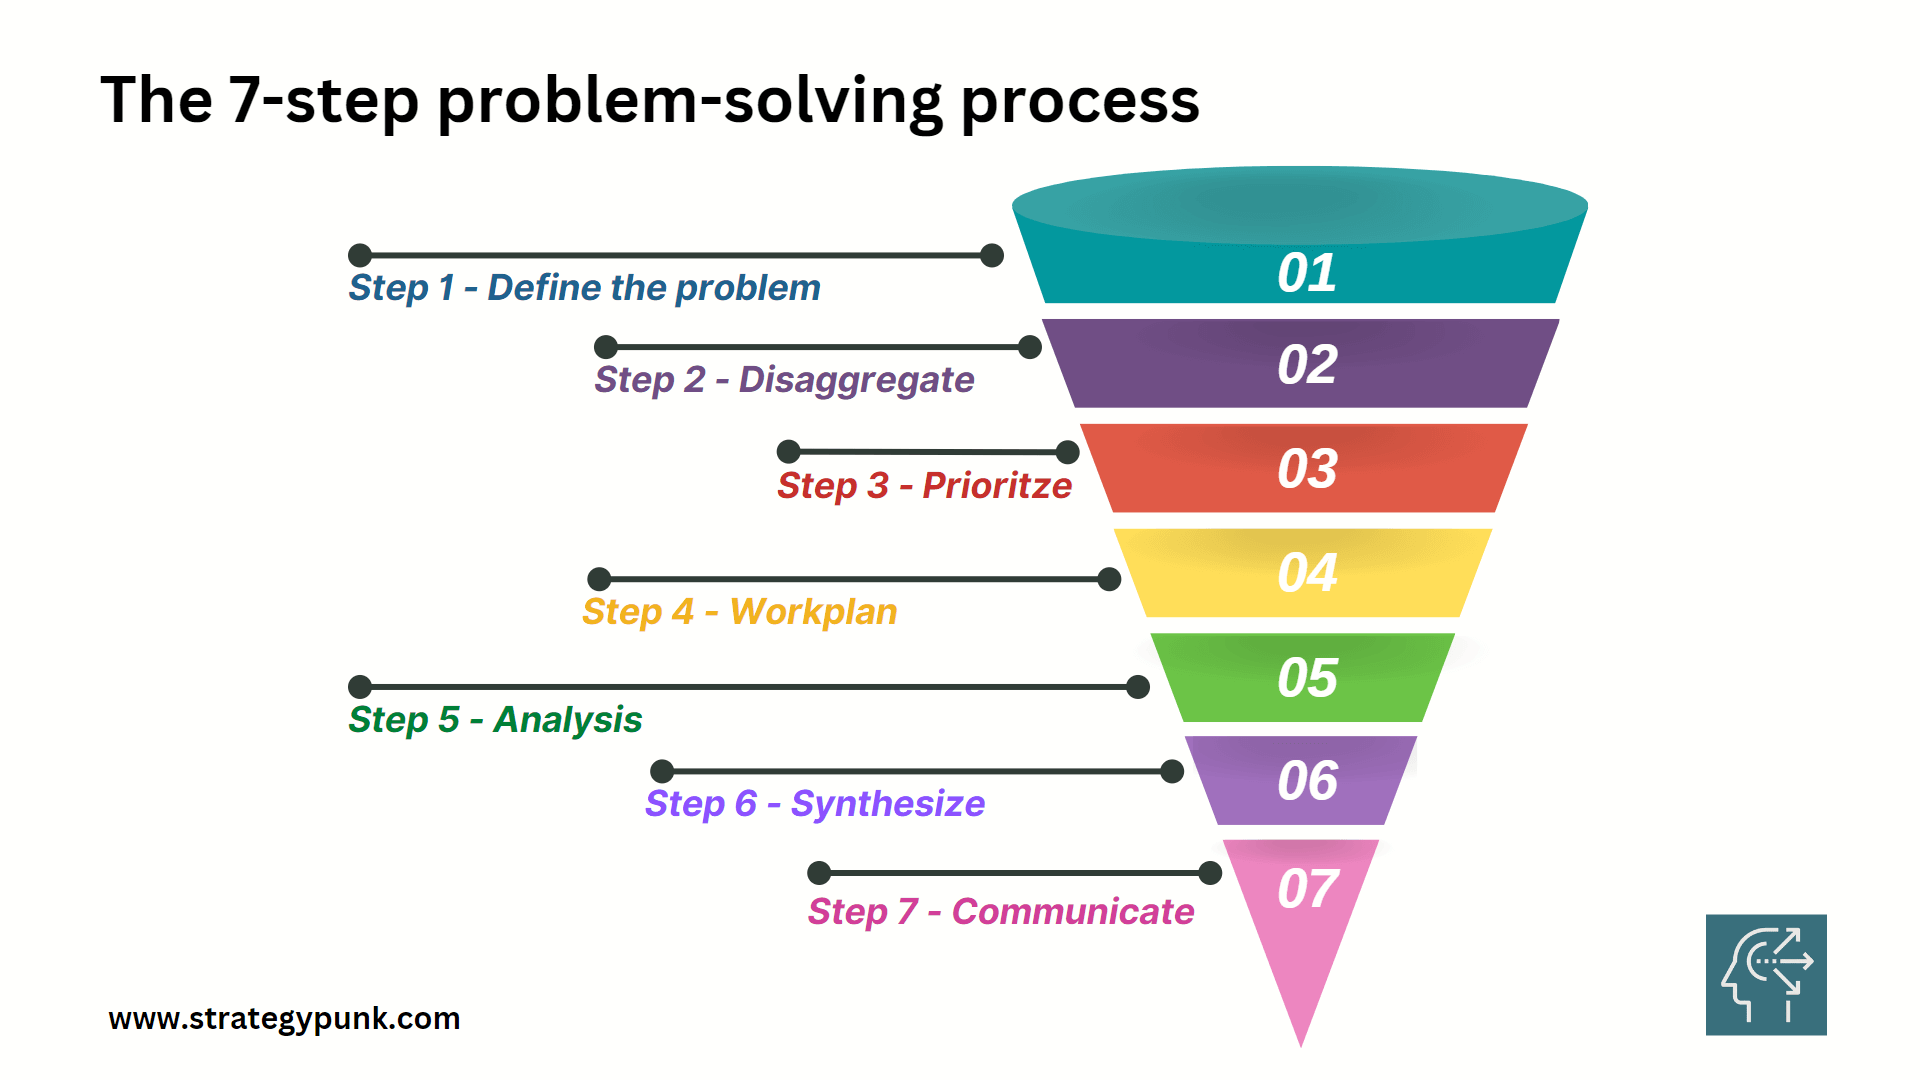
Step 1: Define the Problem
The first step in the problem-solving process is to define the problem. This step is crucial because finding a solution is only accessible if the problem is clearly defined. The problem must be specific, measurable, and achievable.
One way to define the problem is to ask the right questions. Questions like "What is the problem?" and "What are the causes of the problem?" can help. Gathering data and information about the issue to assist in the definition process is also essential.
Another critical aspect of defining the problem is identifying the stakeholders. Who is affected by it? Who has a stake in finding a solution? Identifying the stakeholders can help ensure that the problem is defined in a way that considers the needs and concerns of all those affected.
Once the problem is defined, it is essential to communicate the definition to all stakeholders. This helps to ensure that everyone is on the same page and that there is a shared understanding of the problem.
Step 2: Disaggregate
After defining the problem, the next step in the 7-step problem-solving process is to disaggregate the problem into smaller, more manageable parts. Disaggregation helps break down the problem into smaller pieces that can be analyzed individually. This step is crucial in understanding the root cause of the problem and identifying the most effective solutions.
Disaggregation can be achieved by breaking down the problem into sub-problems, identifying the contributing factors, and analyzing the relationships between these factors. This step helps identify the most critical factors that must be addressed to solve the problem.
A tree or fishbone diagram is one effective way to disaggregate a problem. These diagrams help identify the different factors contributing to the problem and how they are related. Another way is to use a table to list the other factors contributing to the situation and their corresponding impact on the issue.
Disaggregation helps in breaking down complex problems into smaller, more manageable parts. It helps understand the relationships between different factors contributing to the problem and identify the most critical factors that must be addressed. By disaggregating the problem, decision-makers can focus on the most vital areas, leading to more effective solutions.
Step 3: Prioritize
After defining the problem and disaggregating it into smaller parts, the next step in the 7-step problem-solving process is prioritizing the issues that need addressing. Prioritizing helps to focus on the most pressing issues and allocate resources more effectively.
There are several ways to prioritize issues, including:
- Urgency: Prioritize issues based on their urgency. Problems that require immediate attention should be addressed first.
- Impact: Prioritize issues based on their impact on the organization or stakeholders. Problems with a high impact should be given priority.
- Resources: Prioritize issues based on the resources required to address them. Problems that require fewer resources should be dealt with first.
It is important to involve stakeholders in the prioritization process, considering their concerns and needs. This can be done through surveys, focus groups, or other forms of engagement.
Once the issues have been prioritized, developing a plan of action to address them is essential. This involves identifying the resources required, setting timelines, and assigning responsibilities.
Prioritizing issues is a critical step in problem-solving. By focusing on the most pressing problems, organizations can allocate resources more effectively and make better decisions.
Step 4: Workplan
After defining the problem, disaggregating, and prioritizing the issues, the next step in the 7-step problem-solving process is to develop a work plan. This step involves creating a roadmap that outlines the steps needed to solve the problem.
The work plan should include a list of tasks, deadlines, and responsibilities for each team member involved in the problem-solving process. Assigning tasks based on each team member's strengths and expertise ensures the work is completed efficiently and effectively.
Creating a work plan can help keep the team on track and ensure everyone is working towards the same goal. It can also help to identify potential roadblocks or challenges that may arise during the problem-solving process and develop contingency plans to address them.
Several tools and techniques can be used to develop a work plan, including Gantt charts, flowcharts, and mind maps. These tools can help to visualize the steps needed to solve the problem and identify dependencies between tasks.
Developing a work plan is a critical step in the problem-solving process. It provides a clear roadmap for solving the problem and ensures everyone involved is aligned and working towards the same goal.
Step 5: Analysis
Once the problem has been defined and disaggregated, the next step is to analyze the information gathered. This step involves examining the data, identifying patterns, and determining the root cause of the problem.
Several methods can be used during the analysis phase, including:
- Root cause analysis
- Pareto analysis
- SWOT analysis
Root cause analysis is a popular method used to identify the underlying cause of a problem. This method involves asking a series of "why" questions to get to the root cause of the issue.
Pareto analysis is another method that can be used during the analysis phase. This method involves identifying the 20% of causes responsible for 80% of the problems. By focusing on these critical causes, organizations can make significant improvements.
Finally, SWOT analysis is a valuable tool for analyzing the internal and external factors that may impact the problem. This method involves identifying the strengths, weaknesses, opportunities, and threats related to the issue.
Overall, the analysis phase is critical for identifying the root cause of the problem and developing practical solutions. By using a combination of methods, organizations can gain a deeper understanding of the issue and make informed decisions.
Step 6: Synthesize
Once the analysis phase is complete, it is time to synthesize the information gathered to arrive at a solution. During this step, the focus is on identifying the most viable solution that addresses the problem. This involves examining and combining the analysis results for a clear and concise conclusion.
One way to synthesize the information is to use a decision matrix. This involves creating a table that lists the potential solutions and the essential criteria for making a decision. Each answer is then rated against each standard, and the scores are tallied to arrive at a final decision.
Another approach to synthesizing the information is to use a mind map. This involves creating a visual representation of the problem and the potential solutions. The mind map can identify the relationships between the different pieces of information and help prioritize the solutions.
During the synthesis phase, it is vital to remain open-minded and consider all potential solutions. Involving all stakeholders in the decision-making process is essential to ensure everyone's perspectives are considered.
Step 7: Communicate
After synthesizing the information, the next step is communicating the findings to the relevant stakeholders. This is a crucial step because it helps to ensure that everyone is on the same page and that the decision-making process is transparent.
One effective way to communicate the findings is through a well-organized report. The report should include the problem statement, the analysis, the synthesis, and the recommended solution. It should be clear, concise, and easy to understand.
In addition to the report, a presentation explaining the findings is essential. The presentation should be tailored to the audience and highlight the report's key points. Visual aids such as tables, graphs, and charts can make the presentation more engaging.
During the presentation, it is essential to be open to feedback and questions from the audience. This helps ensure everyone agrees with the recommended solution and addresses concerns or objections.
Effective communication is vital to ensuring the decision-making process is successful. Stakeholders can make informed decisions and work towards a common goal by communicating the findings clearly and concisely.
The 7-step problem-solving process is a powerful tool for helping individuals and organizations make better decisions. By following these steps, individuals can identify the root cause of a problem, prioritize potential solutions, and develop a clear plan of action. This process can be applied to various scenarios, from personal challenges to complex business problems.
Through disaggregation, individuals can break down complex problems into smaller, more manageable parts. By prioritizing potential solutions, individuals can focus their efforts on the most impactful actions. The work step allows individuals to develop a clear action plan, while the analysis step provides a framework for evaluating possible solutions.
The synthesis step combines all the information gathered to develop a comprehensive solution. Finally, the communication step allows individuals to share their answers with others and gather feedback.
By mastering the 7-step problem-solving process, individuals can become more effective decision-makers and problem-solvers. This process can help individuals and organizations save time and resources while improving outcomes. With practice, individuals can develop the skills to apply this process to a wide range of scenarios and make better decisions in all areas of life.
7-Step Problem-Solving Process PPT Template
Free powerpoint and pdf template, executive summary: the 7-step problem-solving process.
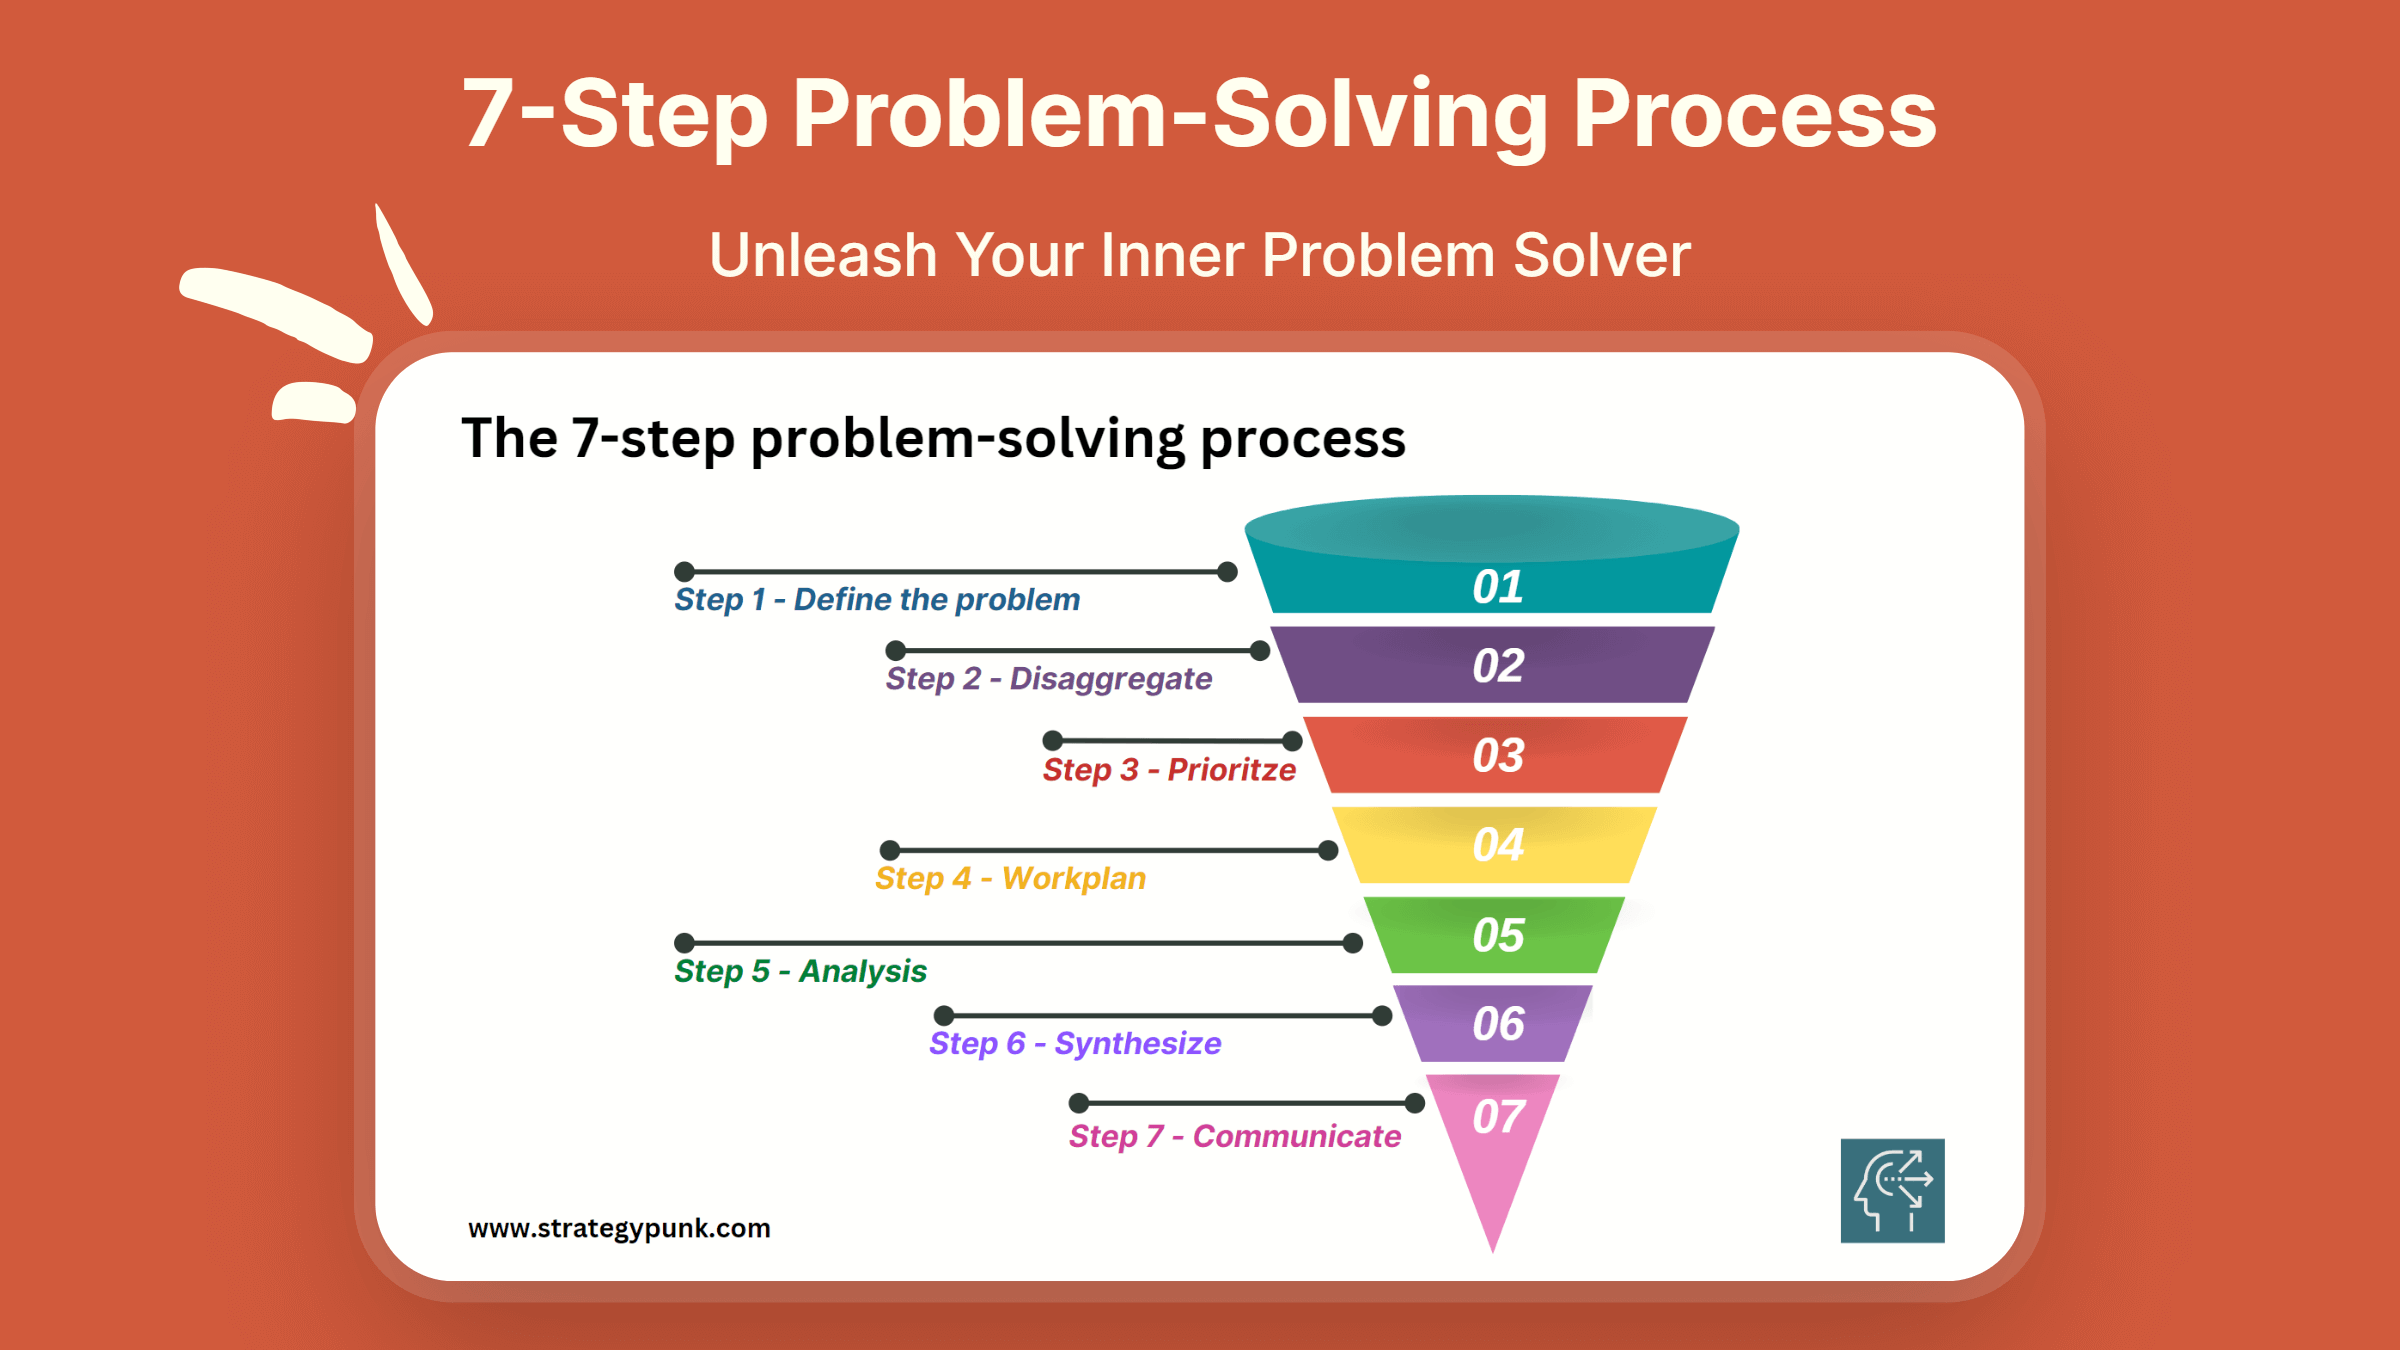
The 7-Step Problem-Solving Process is a robust and systematic method to help individuals and organizations make better decisions by tackling complex issues and finding practical solutions. This process comprises defining the problem, disaggregating it into smaller parts, prioritizing the issues, creating a work plan, analyzing the data, synthesizing the information, and communicating the findings.
By following these steps, individuals can identify the root cause of a problem, break it down into manageable components, and prioritize the most impactful actions. The work plan, analysis, and synthesis steps provide a framework for developing comprehensive solutions, while the communication step ensures transparency and stakeholder engagement.
Mastering this process can improve decision-making and problem-solving capabilities, save time and resources, and improve outcomes in personal and professional contexts.
Please buy me a coffee.
I'd appreciate your support if my templates have saved you time or helped you start a project. Buy Me a Coffee is a simple way to show your appreciation and help me continue creating high-quality templates that meet your needs.

7-Step Problem-Solving Process PDF Template
7-step problem-solving process powerpoint template.

Global Bites: PESTLE Insights into Nestlé (Free PPT)
Download our free PPT template for in-depth PESTLE insights into Nestlé's global strategy. Learn more today!

PESTLE Analysis: Decoding Reddit's Landscape (Free PPT)
Decode Reddit's global influence with our free PowerPoint PESTLE Analysis. Explore the hub of vibrant discussions and ideas.

Navigating the Terrain: A PESTLE Analysis of Lululemon (Free PowerPoint)
Explore Lululemon's business terrain with our free PESTLE analysis PowerPoint. Instant access!

The Art of Strategic Leadership: 5 Keys to Success by Willie Peterson
Explore Willie Peterson's 5 crucial strategies for strategic leadership. Master learning, customer focus, and effective storytelling.

IMAGES
VIDEO
COMMENTS
Here in this post, you will find the complete 7 steps of the QC story. As a quality engineer, you will be working on problem-solving scenarios in the organization. And the concept of QC story is the same to solve problems using the step-by-step approach to solve the problem by assigning the project and completion.
Eliminate the cause of the problem permanently. The five Ws and one H: who, when, where, what, why and how, for the improved job must be identified and used as a standard. Necessary preparation and communication regarding the standards should be carried out correctly. Education and training should be implemented.
QC STORY and PROBLEM SOLVING. QC Story is a tool of TQM (Total Quality Management), which is intended to solve problems in a structured way. QC story is based on the principle of PDCA, where the nine steps can present the full story of the choice of the case to complete solutions. QC Story tool is not among the most popular in the world ...
Quality Glossary Definition: Seven tools of quality "The Old Seven." "The First Seven." "The Basic Seven." Quality pros have many names for these seven basic tools of quality, first emphasized by Kaoru Ishikawa, a professor of engineering at Tokyo University and the father of "quality circles."Start your quality journey by mastering these tools, and you'll have a name for them too: indispensable.
They are called basic quality tools because they can be easily learned by anyone even without any formal training in statistics. Dr. Kaoru Ishikawa played the leading role in the development and advocacy of using the 7 quality tools in organizations for problem-solving and process improvement. The 7 basic quality tools include; Flowchart; Histogram
Learn what QC Story is and the difference between QC Story and PDCA. ...
QC Circles were organized in Japan as a way of getting operators to participate in quality control activities. In order to be efficient and effective in their problem-solving activities, members ...
Welcome to this course on the "7 QC Tools". These are simple yet powerful and effective tools for problem solving, with a wide applicability across different sectors, whether it is manufacturing or service sector. I believe that every member of your team, who is involved in problem solving of any nature, should have a good insight and exposure ...
Introduction to 7 QC tools Quality management is an important aspect of any organization, and achieving it requires effective problem-solving strategies. In this regard, the 7 QC tools offer a comprehensive approach to problem-solving and quality improvement. These tools are designed to help organizations identify the root cause of problems, make data-driven decisions, and ultimately
Finding a suitable solution for issues can be accomplished by following the basic four-step problem-solving process and methodology outlined below. Step. Characteristics. 1. Define the problem. Differentiate fact from opinion. Specify underlying causes. Consult each faction involved for information. State the problem specifically.
seven quality control (QC) tools in the organizations for problem solving and process improvements. Seven old quality control tools are a set of the QC tools that can be used for improving the performance of the production processes, from the first step of producing a product or service to the last stage of production. So, the general purpose ...
To conduct QC Story workshop in Chennai, Bangalore, Mumbai, Delhi and across India and to know more about the curriculum & structure & customization to your needs, contact us. This QC workshop helps Process & Engineering Managers to appreciate the principles & concept of 7 step QC Story approach for problem solving and how to can be applied to ...
The document describes the 7 steps of quality control (QC) problem solving. It includes: 1. The 7 steps are: select topic, understand situation and set targets, plan activities, analyze causes, consider and implement countermeasures, check results, and standardize and establish control. 2. The 7 QC tools that support the 7 steps are: Pareto diagrams, cause-and-effect diagrams, graphs and ...
Unfortunately, the complexity of the subject intimidated most workers, so Ishikawa focused primarily on a reduced set of tools that would suffice for most quality-related issues. The 7 QC tools are: Check sheet. Fishbone diagram (cause and effect diagram, or Ishikawa diagram) Histogram. Pareto chart. Control chart.
The 7 QC Tools are simple tools, low-cost and easy-to-use; but they are powerful tools that forms the critical foundation for all problem solving and quality improvement activities. Our online training method is logical, systematic, and proven effective. This 7QC tools course provides solid foundation for individuals' and team's root cause analyses, problem solving sessions, and continuous ...
7 QC Tools are also known as Seven Basic Quality Tools and Quality Management Tools. These graphical and statistical tools are used to analyze and solve work-related problems effectively. The 7 Quality Tools are widely applied by many industries for product and process improvements, and to solve critical quality problems.. 7QC tools are extensively used in various Problem Solving Techniques ...
I will help you to understand the basic ideas and knowledge of 7QC Tools and their usage. For solving problems seven QC tools are used Pareto Chart, Cause & Effect Diagram, Histogram, Control Charts, Scatter Diagrams, Graphs/Process Flow Diagram, and Check Sheets. All these tools are important tools used widely in the manufacturing field to ...
7 STEPS PROBLEM SOLVING & 7 QC TOOLS 9:00 am to 5:00pm 15-16 October 2014, Wed - Thu FMM Kedah Perlis, Sg Petani INTRODUCTION This program is designed to empower employees to solve problems and carry out improvement projects in systematic, fact-based approach. Participant will not only learn all the 7 QC Tools, but when to timely apply the ...
To discuss the art of problem solving, I sat down in California with McKinsey senior partner Hugo Sarrazin and also with Charles Conn. Charles is a former McKinsey partner, entrepreneur, executive, and coauthor of the book Bulletproof Problem Solving: The One Skill That Changes Everything [John Wiley & Sons, 2018].
If we are not reach at target then again repeat the process of QC steps. There are 12 steps of Quality circle are as follows: Identification of work related problems. Selection of problem. Define the problem. Analyze the problem. Identification of cause. Finding out the root cause. Data analysis.
The 7-Step Problem-Solving Process involves steps that guide you through the problem-solving process. The first step is to define the problem, followed by disaggregating the problem into smaller, more manageable parts. Next, you prioritize the features and create a work plan to address each. Then, you analyze each piece, synthesize the ...