Maths with David
Problem solving. draw diagram.
In mathematics, diagrams are often a useful way of organising information and help us to see relationships. A diagram can be a rough sketch, a number line, a tree diagram or two-way table, a Venn diagram, or any other drawing which helps us to tackle a problem.
Labels (e.g. letters for vertices of a polygon) are useful in a diagram to help us be able to refer to items of interest.
A diagram can be updated as we find out new information.
Examples of using a diagram to tackle a problem
First we will read all three examples and have a quick think about them and then we will look at how a diagram can help us with each one:
Restaurant Example
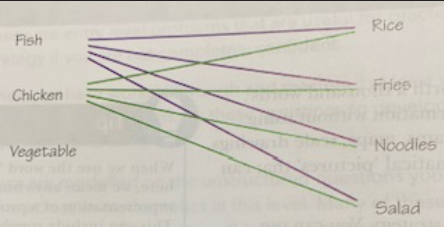
A restaurant offers a “business lunch” where people can choose either fish or chicken or vegetables for their main course, accompanied by a side portion of rice, chips, noodles or salad. How many different combined meals can they choose between?
Rectangle Area Example
To the nearest centimetre, the length and width of a rectangle is 10cm and 8cm.
- What are the limits of accuracy for the area of the rectangle?
- the lengths of the sides?
Prime Numbers Example
Masha says that if she writes out numbers in rows of six then all of the prime numbers will either be in the column that has 1 at the top, or they will be in the column that has 5 at the top. How can you find out if she is correct?
Worked Solutions to Examples
One way to tackle this would be to write out a list, being systematic to ensure that all combinations are considered.
Another is to draw out a diagram like the one below. As shown, you actually don’t need to finish the diagram in order to conclude how many combinations there are:
You could also use a 2-way table as shown below:
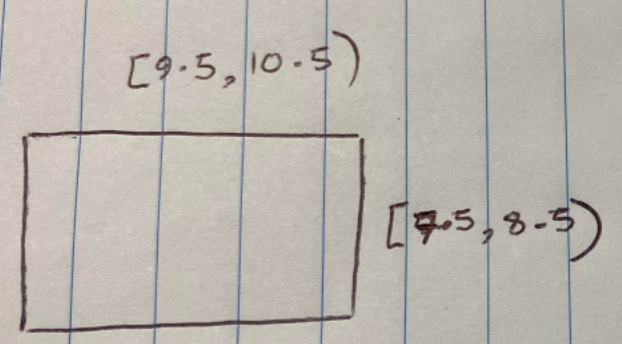
Drawing a rough sketch of the rectangle labelled with the boundaries of its side lengths can really help us to visualise the situation here:
It can then be helpful to draw sketches of the smallest possible rectangle and the largest possible rectangle:
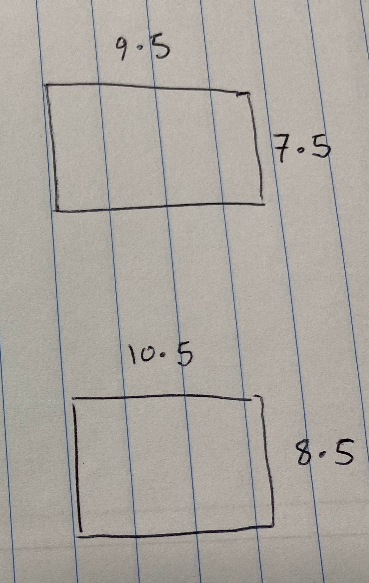
We can now answer the questions, so (a) the smallest possible area is 7.5 x 9.5 = 71.25cm 2 and the largest “possible” area is 8.5 x 10.5 = 89.25cm 2 . So the limits of accuracy are [71.25,89.25) cm 2 .
For (b), we can see from the sketches that the difference between the minimum and the maximum values is 1cm in the case of both the width and the lenght. For part (ii) we simply subtract the numbers above to give 89.25-71.25 = 18cm 2 .
Here, listing out numbers, especially for the first few is going to be helpful. We should list them as specified in the question, and we can highlight the prime numbers:
Because we know that no even numbers other than 2 are prime, we know that further prime numbers cannot be in the second, fourth or sixth column. The third column keeps adding 6s, so it is adding multiples of 3 to multiples of 3, so the numbers will always be divisible by 3, so further numbers in this column cannot be prime. So she is correct that the prime numbers must be in the first or the fifth column.
31 Questions of increasing difficulty
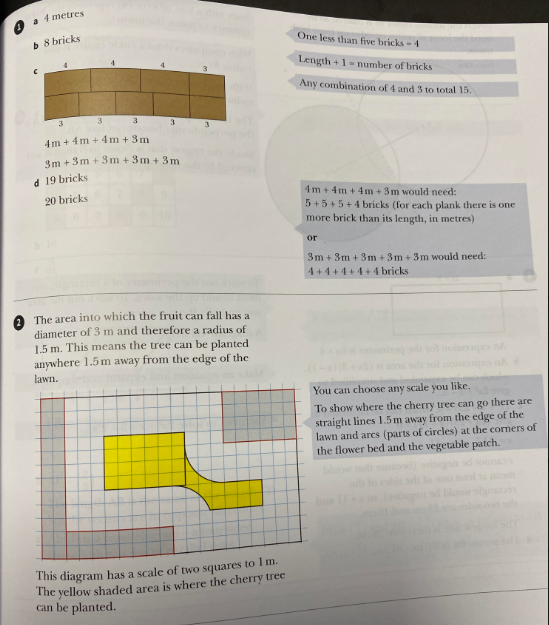
1.) In a cement factory, cement bags are placed on pallets made of planks of wood and bricks. The number of bricks needed to make a pallet is calculated as being one more than the length of the plank in metres (as shown below):
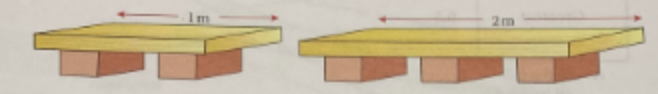
a.) What length of pallet uses five bricks?
b.) If the pallet is 7m long, how many bricks are used in it?
The factory needs pallets with a total length of 15m for the next batch of cement. It has planks of wood that are 4m long and 3m long.
c.) What combinations of planks can they have?
d.) How many bricks would be needed for each combination?
2.) Sonia wants to plant an apple tree in her garden. She needs to make sure that there is a circular area of lawn with diameter 3m around the base of the tree, so that all of the fruit will fall onto the lawn area.
Below is a (not to scale) sketch of Sonia’s garden:
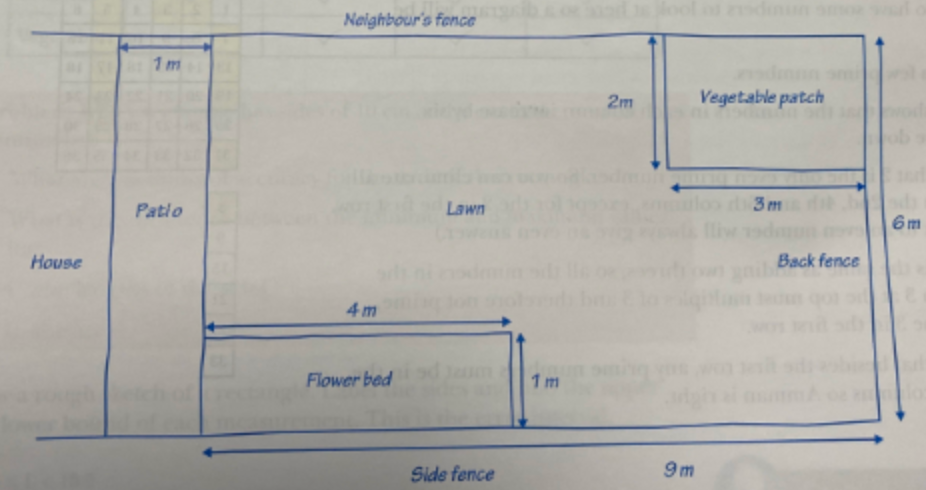
Where could the tree be placed to meet her requirements?
3.) The diagram below represents towns A and B in a mountainous region:
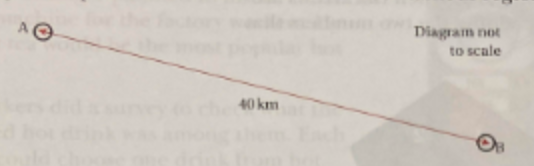
The mountain rescue helicopters from both towns will always be sent to rescue any casualty within a 25km radius of town A or town B. The fire and rescue team from town B will travel to any accident scene closer to town B than town A.
Shade the region that the helicopters and town B’s fire an rescue team will both cover.
4.) A rectangle has length (2x+3) and width (x-1).
a.) Write an expression for the perimeter of the rectangle.
b.) Write an expression for the area of the rectangle.
The area of the rectangle is 250cm 2 .
c.) How long is the longest side?
d.) What is the perimeter of the rectangle?
5.) The probability that Hannah catches the 6.30am train to the city is 0.7.
If she misses the train, she will be late for work.
The probability that the train will be late is 0.15.
If the train is late, she will be late for work.
What is the probability that Hannah will be on time for work on a particular day?
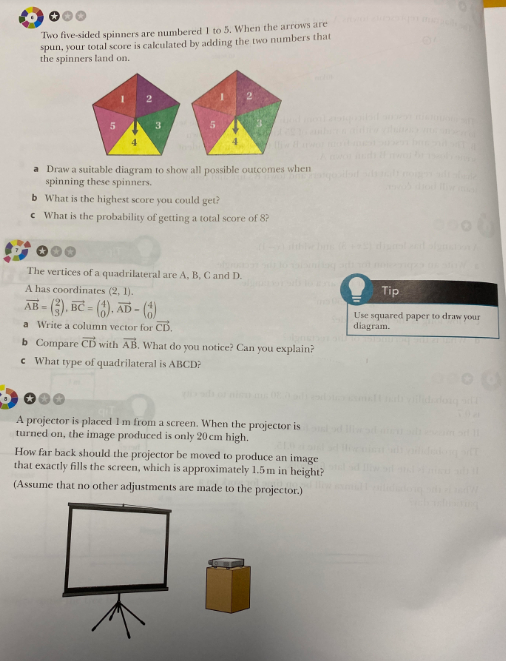
6.) Two five-sided spinners are numbered 1 to 5. When the arrows are spun, your total score is calculated by adding the two numbers that the spinners land on.
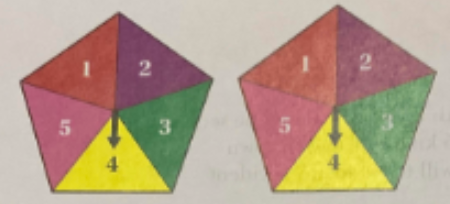
a.) Draw a suitable diagram to show all possible outcomes when spinning these spinners.
b.) What is the highest score you could get?
c.) What is the probability of getting a total score of 8?
Worked Solutions to Questions

Share this:

- Already have a WordPress.com account? Log in now.
- Subscribe Subscribed
- Copy shortlink
- Report this content
- View post in Reader
- Manage subscriptions
- Collapse this bar
Powerful online learning at your pace

Using Strip Diagrams as a Problem-Solving Strategy
There’s a lot to be learned from the data that comes from state testing if we use it correctly . Oftentimes, we’ll take a problem that students, as a whole, perform poorly on and we create a bunch of problems just like that one and “teach” them how to work that type of problem. In the end, that’s not an effective strategy, because they’ll probably never see a problem exactly like that one again. A more effective way to use the data is to analyze the wrong answers to determine underlying misconceptions that resulted in the wrong answers and provide students with strategies and tools to improve their overall mathematical reasoning. As far as strategies go, drawing strip diagrams is one of the most powerful strategies students can have in their toolbox. And I have some super clear examples to persuade you!
This post contains affiliate links, which simply means that when you use my link and purchase a product, I receive a small commission. There is no additional cost to you, and I only link to books and products that I personally use and recommend.
The test items in this post come from the 2021 State of Texas Assessments of Academic Readiness (STAAR) test. A wonderful organization called lead4ward analyzes the test each year and provides error analysis statistics.
Analyzing errors
Let’s get started! As you can see from this test item, only roughly half of the students in the state got the correct answer. Look at the most common wrong answer, choice H. Can you see the error that the students who chose that answer made? Take a minute to figure it out before you scroll down.

Look closely at the order of the numbers in the problem. The smaller number comes first in the problem. Students who chose H realized it was a subtraction problem, but took the numbers in order from the problem and subtracted them. So they did 379 – 514. Nine minus 4 is 5. Seven minus 1 is 6. They couldn’t do 3 minus 5, so they did 5 minus 3. The answer they got was 265. Your first thought might be, I need to make sure my students always know to subtract the smaller number from the bigger number. Except that’s not true. If the temperature is 18 degrees and the temperature drops 29 degrees… We need to be extremely careful to not teach “rules” that expire .
The students who chose H lacked an understanding of the meaning of the numbers in the problem. The way we help them be more successful with problems like this is to give them tools to improve their comprehension of word problems and the numbers they contain. Enter strip diagrams.
Using drawings to describe problems
Drawing strip diagrams is a process that actually begins in Kindergarten and 1st grade when students should be drawing pictures to represent word problems. Students should understand that the numbers in a problem represent something—pizzas, soccer players, apples, money saved—and their drawings should include labels identifying what the numbers represent. At this point, the drawings don’t need to resemble strip diagrams. What’s important is the labeling. It could look something like what you see here.

Notice a couple of things. First, the boys and girls are represented by circles. Easy to draw and count. Students need to understand that these are math pictures, not art pictures. Next, and of critical importance, are the labels.
Beginning in 2nd grade, students can begin to draw more formal strip diagrams. Strip diagrams, also called tape diagrams, are often associated with Singapore Math. Char Forsten’s Step-by-Step Model Drawing is the book I learned model drawing from. Another great resource is Math Playground’s Thinking Blocks .
Modeling how to draw a strip diagram
Now let’s get back to that released test item I started this post with and see what the model-drawing process might look like.

This problem is a comparison subtraction problem. We always want students to draw the model with labels first. they will add the numbers in the next step.
Teacher: [Reads problem out loud] What is this story about? (lions) How many lions? (2) What does the problem tell us about the lions? (their weight) Do we know their weights? (yes) Which lion weighs more? (the older lion) What is the problem asking us to find? (the difference in their weights) Huh, what does that mean? (The older lion weighs more than the younger lion. The problem is asking how much more.)
NOTE: Notice that we didn’t talk about the numbers at all! The point of this discussion is to help students make sense of the numbers in the problem and verbalize what the problem is asking them to find.
Teacher: Drawing a model really helps me understand what math I need to do to solve a problem. Let’s draw a model to represent this problem. We know that the older lion weights more, so his bar should be longer, right? [draws and labels the older lion’s bar] That means the younger lion’s bar should be shorter. [draws and labels younger lion’s bar] And you guys told me the problem is asking for the difference. [adds the difference with a question mark]

Now we can plug in the numbers from the problem.

Notice that what I’ve described is very scripted. I want students to hear my mathematical thinking, and I’m teaching them the mechanics of drawing the model. But it’s important to let students use the tool to solve problems. Think how the models would look for these variations of the problem:
There are two lions at the zoo. The weight of the younger lion is 379 pounds. That’s 135 less than the weight of the older lion. How much does the older lion weigh?
There are two lions at the zoo. The weight of the older lion is 514. That’s 135 more than the weight of the younger lion. How much does the younger lion weigh?
Remember, our goal is for students to be able to use strip diagrams to solve new types of problems, so once they understand and can use the model, we have to give them new types of problems to solve without scripted instruction.
More examples of strip diagrams
Let’s take a look at a few more problems from the same test. Each of these problems had pretty dismal results.
This first problem is what we in Texas call a gridable . That means it’s not multiple choice—students have to write and bubble in their answers. A lot of times students will miss gridables due to calculation errors. But I’m pretty sure that’s not the case here. I doubt they miscalculated 4 x 5. What that means is that 38% of the 3rd-grade students in Texas did not recognize this as a multiplication problem. They likely added 4 + 5. Teaching keywords could be the culprit. Students see the word total in the problem, and they’ve been taught that total means addition. Teaching keywords basically gives students permission to not read and understand the problem—just find the keyword and plug the numbers into the operation. Not a sound problem-solving strategy. Instead, we see how a strip diagram could be drawn to represent the problem.

Here’s another multiplication problem. You can see from the error analysis that only 52% of the 3rd-graders correctly answered this problem. Answers B and D are calculation errors. Can you figure out the error these students made? Doing so can help you prevent these types of errors by addressing them in your instruction. Answer choice C results from adding the two numbers, not multiplying. Again, we see the keyword total in the question. Drawing a model would not only help the students visualize the problem as multiplication, but it might also prevent calculation errors. Students who are not confident with the standard algorithm could solve the problem with repeated addition.

Last one and it’s a doozy! Look at that error distribution. When it’s spread out like that, it usually means the kids just didn’t have a clue and guessed. There’s a lot going on here. How could we help students tackle a problem like this?

First, of course, is drawing a model. We see that this is a part/whole problem with three parts, one of which is missing. If you looked carefully at the wrong answers, answer choice F was adding all three numbers. Pretty hard to look at this model and think you’re supposed to add all three numbers.

Aside from model drawing, however, students should learn to write equations to match their models. That’s really the other thing that was hard about this problem. They weren’t asked to solve the problem, just find the correct way to solve it.
Final thoughts
Strip diagrams have to be presented to students as a problem-solving tool and they have to be used consistently. Yes, it takes longer for students to draw strip diagrams to represent their problems, but it should be an expectation. That means we probably need to assign fewer problems to allow students the time to draw their strip diagrams.
The labels are a must! If students can’t label their numbers, it’s a huge red flag. Work with those students in small groups to help them develop comprehension skills.
Students who say they know the answer without drawing a strip diagram should be reminded that we draw models when the problems are easy so we can use them as a problem-solving tool when the problems get harder. And if a large percentage of students can really solve the problems without drawing models are we challenging them enough?
So there you have it. Have I sold you on having students draw strip diagrams? Do you have tips of your own to share? I hope you’ll sound off in the comments.

Similar Posts

Getting to the Heart of a Math Word Problem
Consider this math word problem: Mario and Terrence have both been saving their allowance. Mario has saved $35 and Terrence has saved $52. What math is the problem asking you…

What’s My Number? Differentiating in K-1
In her book How Children Learn Number Concepts*, Kathy Richardson devotes an entire chapter to composing and decomposing numbers. It may surprise you that the title of the chapter is…

Strategy-Based Fact Instruction
It’s heartbreaking when a student not only doesn’t know a fact like 8 + 4, but also has no strategy for figuring it out. Especially when that student is a…

Kindergarten Number Combinations and Fact Fluency
In the landscape of early childhood education, the significance of learning number combinations through 10 in kindergarten cannot be overstated. While it might seem like just one of many skills…

Making Sense of Rounding
Have you ever thought that maybe people who think they are not good at math really have just never been taught math in a way that makes sense to them?…

Thinking Flexibly About Place Value
New standards call for an increased emphasis on understanding place value, rather than just, for example, identifying the digit in a certain place value position (eg., In the number 345,…
13 Comments
Strip/bar/tape diagrams are becoming one of my favorite strategies. The labels are crucial and I need to be better at expecting that. I am nearly to the part of 3rd grade where I will be teaching 2 step problems again and I think continuing the strip/tape/bar diagram representation is going to be a wonderful tool. Here’s hoping!
Thanks for your comment, Jessica! They are one of my favorites as well. So very powerful! Come back and let us know how it goes.
Any way we can show visuals for problems are going to support student understanding! Thank you for adding another tool to my teaching tool box! I teach 1st grade and I want to build my students’ confidence and understanding of math!
That’s wonderful, Suzanne! It’s so important that our students develop a positive math identity early.
Hi Donna, I am increasingly interested in the connections between literacy and math. Your post about how kids start by representing their mathematical thinking/problem solving with pictures, then labels, then drawing a model and later abstract number sentences. seems so similar to how young children write stories first with pictures, then we ask them to label and later on write sentences with words, punctuation etc. Do you know of any research linking the two? Thanks! Jennifer
You are so very correct! There are tons of professional books connecting the two. Solving word problems requires comprehension of the problem. Just like reading teachers tell their students to “make a movie in their head” when they read, I tell my math students the very same thing!
Thank you so much for breaking down strip diagrams. This is a tool I try to encourage my students to use, but I feel like I need to do more modeling for them after reading this. I also like how you pointed out we should analyze the best wrong answers for misconceptions.
I have been using strip diagrams to teach my 2nd graders for a few years. They always seem to struggle with understanding where to put the numbers when the story is comparing. How many more toys does Grant have than Amanda? So, I always pointed out that it’s a comparison, and that seemed to help. I am now a K-5 math interventionist and some upper grades teachers think it will be confusing to call that a comparison when they are not using >, <, = symbols. How can I help them understand those problem types, and is there harm in using the word comparison? I think they are still comparing – "how many more".
A strip diagram for comparison looks different. It’s one bar on top of the other. The difference is where the longer bar is shorter than the shorter bar. That might help with the confusion. Absolutely use the word comparison!
Hi Donna. I’m wondering how strip diagrams are any different than the part part whole organizer. They seem so similar to me. I’ve done a lot of work getting my students to use and understand the PPW as a tool. I like the idea of the strip diagram but fear I’ll confuse them if I introduce a new tool to use in place of a PPW.
They are very similar! Often students transition to strip diagrams in the intermediate elementary grades. No need to do both though.
Hi Donna! I started using tape diagrams with my students when my district adopted the Engage NY/Eureka Math Curriculum. I found that students have had great success in using this strategy. Thank you for this clear explanation on using tape diagrams during problem solving.
It’s such a powerful strategy! I’m glad to hear your students found success using it!
Leave a Reply Cancel reply
Your email address will not be published. Required fields are marked *
Standards Alignment
Assessments, professional learning, family engagement, case studies.
NEW EUREKA MATH 2 ® PILOT PACKAGE
Are you looking for new ways to advance equity and build knowledge in your math classroom with high-quality instructional materials? EdReports recently reviewed Eureka Math 2 . Scan the QR code or access the final report .
Check out our special pilot package for only $10 per student.
Shop Online

SEE THE SCIENCE OF READING IN ACTION
At Great Minds ® , we’re committed to ensuring our curricula are aligned to the latest research on how students best learn to read, write, and build knowledge.
Explore webinars, blogs, research briefs, and more to discover how we incorporate this important body of research.

FREE CLASSROOM PRINTABLES
At Great Minds®, we’re committed to supporting educators with high-quality curricula and resources.
Explore resources designed to aid students in science and engineering and spark classroom conversation.
Webinar Library
Instructional resources, trending topics, knowledge-building, the science of reading, lesson design, universal design for learning (udl), background knowledge.
Palm Springs, CA
Houston, TX
New Orleans, LA
Topics: Models
Application of the Tape Diagram—A Tool For Problem Solving

by Mary Swanson

every child is capable of greatness.
Posted in: Aha! Blog > Eureka Math Blog > Models > Application of the Tape Diagram—A Tool For Problem Solving
A load of bricks is twice as heavy as a load of sticks. The total weight of 4 loads of bricks and 4 loads of sticks is 771 kilograms. What is the total weight of 1 load of bricks and 3 loads of sticks? (Grade 5, Module 2, Lesson 28)
To solve this Grade 5 problem, my 9th grade daughter first divided 771 by 12 and then multiplied the quotient by 3 and by 2. She then added the two products together to get her answer. When asked why she did it that way, she explained (in one very long run-on sentence) that “since the bricks were twice the sticks and since there are 4 loads of each, that’s really 12, so I divided by 12, and then I multiplied by 3 and then by 2 (since the bricks are twice the sticks) and I added my answers together”. “But,” she concluded, “I have no idea how a 5th grader would do that!”
So, how would a 5th grader solve the problem? One way would be to follow the RDW process and to draw a tape diagram. Through the RDW process, the student would read and reread the problem, draw a tape diagram to help make sense of the information in the problem, solve the problem mathematically, write an answer statement, and then revisit the original problem to determine if his/her answer makes sense.
Consider the following dialogue as a possible interaction with a 5th grade student who is working to solve the problem. This example shows not only the direct power of the tape diagram, but it also shows the prior learning evident in the modules that brings students to the point where they can solve this problem with success.
A load of bricks is twice as heavy as a load of sticks. The total weight of 4 loads of bricks and 4 loads of sticks is 771 kilograms. What is the total weight of 1 load of bricks and 3 loads of sticks?
T: Reread the first sentence. What do we know?
S: We know that there are bricks and that there are sticks.
T: What do we know about the bricks and the sticks?
S: The bricks are heavier.
T: How much heavier?
S: Twice as heavy.
T: Let’s show that relationship using a tape diagram. Draw a tape to represent the weight of the sticks. Now draw another tape to represent the weight of the bricks. Which tape will be longer?
S: The tape for the bricks.
T: How much longer?
S: Twice as long.
T: Show me. Don’t forget to label.

T: What else do we know? Read on.
S: The total weight of 4 loads of bricks and 4 loads of sticks is 771 kilograms.
T: Can we draw something to represent that?
S: Yes. We can draw a tape diagram.
T: If this (pointing to original tape) represents the weight of 1 load of bricks, what would we draw to represent the weight of 4 loads of bricks? Show me.
S: We need to draw three more of that same size to show 4 loads.

T: How would we represent the weight of 4 loads of sticks?
S: We draw 3 more units.
T: Can we label anything else?
S: Yes. We can label the total. It’s 771 kilograms.
T: What do we need to find out?
S: The weight of 1 load of bricks and 3 loads of sticks.

T: Where do you see that in the tapes?
S: Here is 1 load of bricks. Here are 3 loads of sticks.
T: Let’s look back at the problem one more time. Have we drawn everything that we can draw?
At this point, students have drawn a tape diagram to represent the problem, and they are ready to make a plan to solve.
T: The tape diagram helps us to figure out how to solve. What do you see?
S: I see 12 equal-sized units.
T: And what do we know about the units?
S: The total is 771 kilograms.
T: And what do we need to find out?
S: How much 5 of the units would be.
T: How do you know?
S: That’s how much 1 load of bricks and 3 loads of sticks is.
T: How can we determine how much 5 units is?
S: First, we need to figure out 1 unit. Then we can figure out how much 5 units would be. I’ll divide 771 by 12 to find 1 unit. Then I will multiply by 5 to find 5 units.
Students can now use their knowledge of division, multiplication, and addition to determine the answer.

S: My answer is 321.25. 1 load of bricks and 3 loads of sticks weigh 321.25 kilograms.
T: Does your answer make sense?
S: Yes, because the weight of 1 load of bricks and 3 loads of sticks is a little less than half the total weight. 321.25 kilograms is a reasonable answer.
Note that the essential reasoning by both the 9th grader and 5th grader are the same. Both draw the conclusion that 4 loads of bricks and 4 loads of sticks is equivalent to 12 loads of sticks and pursue the answer from there. The tape diagram serves as an access point for the 5th grader, whereas the 9th grader’s fluency with this reasoning allows for instantaneous articulation of the same concept.
Students are first introduced to the tape diagram in Lesson 19 of Module 4, Grade 1. Prior to that module, students are provided with the foundational skills that lead to an understanding of the part/whole relationship and what the tape diagram represents. The transition to the tape diagram is beautiful! If you’d like to see it in action, check out Topic E of Grade 1 — Module 4.
This post is by Eureka Math teacher-writer Mary Swanson.
© Great Minds 2016
Submit the Form to Print

Mary Swanson

Get the Latest Great Minds Updates
Stay informed of simple yet crucial implementation support tips, curriculum updates, new resources, professional development opportunities, and more for math, science, and ELA.

Looking for a hybrid learning resource?
Discover the benefits of Great Minds in Sync ™. A collection of digital and print resources for Eureka Math ®, Wit & Wisdom ® and PhD Science ®.

More blogs on Models:

The Number Bond: A K-5 Model That Fosters Number Sense

The Number Line: A Powerful and Versatile Model

Solving Word Problems Using Tape Diagrams (Part 2)

Solving Word Problems Using Tape Diagrams (Part 1)
Sign up for Eureka Math Blog updates
Every child is capable of greatness.
- Job Openings
- Digital Support
- Print Support
- Media Inquiries
Let’s Connect
- Terms of Service
- Privacy Policy
- System Status
- CA Residents: Do Not Sell My Info
draw a diagram problem solving
All Formats
Resource types, all resource types.
- Rating Count
- Price (Ascending)
- Price (Descending)
- Most Recent
Draw a diagram problem solving

Draw a Picture or Diagram Problem Solving PowerPoint, Task Cards and Worksheet

Draw a picture or diagram problem solving

Blake's Topic Bank - Problem Solving : Drawing a Diagram

Grade 5 - 8.2 - Draw a Diagram to solve fraction division problems
- Google Slides™

Drawing a Diagram to Solve Math Word Problems about Length

Problem Solving - By Drawing a Diagram

Draw a Diagram to Solve Subtraction Word Problems

Prezi: How to draw a diagram to help solve word problems involving fractions

Pythagorean Theorem Solve and Snip® Interactive Word Problems Math Activity

Dry-Erase Pages: Problem Solving w/ Strip Diagrams , Number Lines & Related Facts

Problem Solving Strategy Posters

MATH Strategy Problem Solving Posters, Word Problems, and Evaluation Rubric

Word Problem Graphic Organizer with Editable Text and 12 Multi-Step Problems

Problem Solving Strategies Posters- Solve it like a Superhero!!

Common Core: Multiplication and Division Story Problems Worksheets

Math Problem Solving Strategy Cards

Problem Solving Strategy Posters {Rainbow}

Addition Word Problems to 20, Story Problems with Unknown in All Positions

Maths Problem Solving Strategies Posters

Problem Solving 4 Today Workbook Grade 5 Printable 105013-EB

DOLLAR DEAL! Tape Diagrams Story Problems Tasks Cards Printables 1st

Addition Word Problems to 10, Story Problems with Unknown in All Positions

Using Pythagorean Theorem to Solve Real-World Problems Lesson & Performance Task

- We're hiring
- Help & FAQ
- Privacy policy
- Student privacy
- Terms of service
- Tell us what you think
- Try for free
Problem Solving: Draw a Picture

Problem-solving is a critical 21st Century and social-emotional skill
Looking for more resources on 21st Century skills and social-emotional learning? Find them in our FutureFit resources center .
What Is It?
The draw a picture strategy is a problem-solving technique in which students make a visual representation of the problem. For example, the following problem could be solved by drawing a picture:
A frog is at the bottom of a 10-meter well. Each day he climbs up 3 meters. Each night he slides down 1 meter. On what day will he reach the top of the well and escape?

Why Is It Important?
Drawing a diagram or other type of visual representation is often a good starting point for solving all kinds of word problems . It is an intermediate step between language-as-text and the symbolic language of mathematics. By representing units of measurement and other objects visually, students can begin to think about the problem mathematically . Pictures and diagrams are also good ways of describing solutions to problems; therefore they are an important part of mathematical communication.
How Can You Make It Happen?
Encourage students to draw pictures of problems at the very beginning of their mathematical education. Promote and reinforce the strategy at all subsequent stages. Most students will naturally draw pictures if given the slightest encouragement.
Introduce a problem to students that will require them to draw a picture to solve. For example:
Marah is putting up a tent for a family reunion. The tent is 16 feet by 5 feet. Each 4-foot section of tent needs a post except the sides that are 5 feet. How many posts will she need?
Demonstrate that the first step to solving the problem is understanding it. This involves finding the key pieces of information needed to figure out the answer. This may require students reading the problem several times or putting the problem into their own words.
16 feet by 5 feet 1 post every 4 feet, including 1 at each corner No posts on the short sides
Choose a Strategy
Most often, students use the draw a picture strategy to solve problems involving space or organization, but it can be applied to almost all math problems. Also students use this strategy when working with new concepts such as equivalent fractions or the basic operations of multiplication and division.
In This Article:
Featured high school resources.

Related Resources

About the author

TeacherVision Editorial Staff
The TeacherVision editorial team is comprised of teachers, experts, and content professionals dedicated to bringing you the most accurate and relevant information in the teaching space.
Solving Problems with Trigonometry
Lesson Narrative
In this lesson students apply the concepts of trigonometry to two different situations. In the first, students need to interpret a diagram with limited information to find a way to calculate the dimensions of a polygon. In the second, students are given information about a plane’s flight path, but they need to draw their own diagram as well as grapple with converting units. In each of these situations, students are making sense of problems (MP1) before they are able to use trigonometry to solve the problem.
Learning Goals
Teacher Facing
- Use trigonometry to solve problems (using words and other representations).
Student Facing
- Let’s solve problems about right triangles.
Required Materials
- Geometry toolkits (HS)
- Scientific calculators
Required Preparation
Be prepared to display applets for all to see throughout the lesson.
Learning Targets
- I can use trigonometry to solve problems.
CCSS Standards
- HSG-SRT.C.8
Building Towards
- HSG-GMD.A.1
Print Formatted Materials
Teachers with a valid work email address can click here to register or sign in for free access to Cool Down, Teacher Guide, and PowerPoint materials.
Additional Resources
- Texas Go Math
- Big Ideas Math
- Engageny Math
- McGraw Hill My Math
- enVision Math
- 180 Days of Math
- Math in Focus Answer Key
- Math Expressions Answer Key
- Privacy Policy
McGraw Hill My Math Grade 5 Chapter 10 Lesson 12 Answer Key Problem-Solving Investigation: Draw a Diagram
All the solutions provided in McGraw Hill Math Grade 5 Answer Key PDF Chapter 10 Lesson 12 Problem-Solving Investigation: Draw a Diagram will give you a clear idea of the concepts.
McGraw-Hill My Math Grade 5 Answer Key Chapter 10 Lesson 12 Problem-Solving Investigation: Draw a Diagram

Practice the Strategy

4. Check Is my answer reasonable? Explain. ____________________ Answer: To check whether the answer is reasonable or not. we need to divide and check 18 ÷ 6 = 3 Therefore, the answer is reasonable.
Apply the Strategy
Solve each problem by drawing a diagram.

Question 3. Mathematical PRACTICE 4 Model Math Jacinda is decorating cookies for a class party. She can decorate \(\frac{2}{3}\) of a cookie per minute. At this rate, how many cookies can she decorate in 15 minutes? Answer: The above-given The time she can decorate a cookie per minute = 2/3 The number of cookies she can decorate in 15 minutes = C for 1 minute – 2/3 of the cookie for 15 minutes – how many cookies? (C) C x 1 = 15 x 2/3 C = 30/3 C = 10 Therefore, she can decorate 10 cookies within 15 minutes.
Question 4. At a bird sanctuary, Ricky counted 80 birds. Of the birds he counted, \(\frac{1}{4}\) were baby birds. If he counted an equal number of adult males r and females, how many adult female birds did Ricky count? Answer: The number of birds counted by Ricky = 80 Out of 80 birds, the number of baby birds = 1/4 We can write in mathematical form as: 1/4 of 80 We need to find out the number of adult female birds. from the above-given conditions, we have to calculate 1/4 x 80 = 20 The total number of baby birds = 20 Now subtract the total number of birds and a total number of baby birds. Let it be A. A = 80 – 20 A = 60 Now we got the adult birds (female and male). Here we have to find out about the female birds. Let it be F F = 60/2 F = 30 Therefore, the number of female birds is 30. And finally, we can summarize that the baby birds are 20; female birds are 30; male birds are 30.
Question 5. Mathematical PRACTICE 5 Use Math Tools To make chocolate ice cream, you need about \(\frac{3}{8}\) pound of chocolate. How many pounds of chocolate will you need to make 4 batches of ice cream? Answer: The amount of chocolate we need to make a chocolate Ice-cream = 3/8 The number of pounds of chocolate we need to make 4 batches of ice cream = C C = 3/8 x 4 C = 12/8 C = 3/2 Therefore, 3/2 pounds of chocolate is needed.
Review the Strategies
Use any strategy to solve each problem.
- Draw d diagram.
- Work backwards.
- Guess, check, and revise.
- Act it out.
Question 6. A cook needs 12 pounds of flour. He wants to spend the least amount of money. If a 2-pound bag costs $1.59 and a 5-pound bag costs $2.89, how many bags of each type of flour should he buy? What will be the total cost? Answer: The pounds of flour a cook needs = 12 The cost of a 2-pound bag is $1.59 The cost of a 5-pound bag is $2.89 we can buy two 5-pound bags and one 2-pound bag The total cost can be: 2.89 x 2 = 5.78 (the total cost of 5-pound bags) 1.59 x 1 = 1.59 (the total cost of 2-pound bags) Now add both the costs. The total cost of both bags = 5.78 + 1.59 = 7.37. Therefore, the total cost is $7.37 Question 7. Mathematical PRACTICE 5 Use Math Tools A ride at a theme park lasts 1\(\frac{1}{2}\) minutes. It takes 2 minutes to prepare the ride for each trip. How many times can the ride be completed in 30 minutes? Answer: The minutes to last a ride at a theme park = 1 1/2 = 3/2 = 1.5 minutes The number of minutes will take to prepare the ride for each trip = 2 The number of rides we can complete in 30 minutes = M The total time = 2 + 1.5 = 3.5 If one ride requires 3.5 minutes, the number of rides that can be completed in 30 minutes M = 30/3.5 M = 8.57 M = 8 Therefore, within 30 minutes, 8 times a ride can be completed. Question 8. On Monday, 21 DVDs were checked out at the library. This is 3 less than half the amount of books checked out that day. How many books were checked out? Answer: The number of DVDs was checked on Monday = 21 half of the amount of books = 1/2b The equation can be written as: DVDs = 1/2b – 3 21 = 1/2b – 3 21 + 3 = 1/2b 24 = 1/2b (24 = b/2) b = 2 x 24 b = 48 Therefore, the number of books checked out is 48.
Question 9. Mathematical PRACTICE 4 Model Math Leo takes 30 minutes to eat dinner, 15 minutes to change clothes, and 20 minutes to walk to practice. If Leo needs to be at hockey practice at 7:15 P.M., what time does he need to begin? Answer: The time it takes Leo to eat dinner = 30 min The time it takes Leo to change clothes is 15 min The time it takes Leo to walk is 20 min Add all the minutes: 30 + 15 + 20 = 65 minutes. He needs to begin 1 hour 5 minutes before from 7:15 PM He needs to begin at 6:10 PM

McGraw Hill My Math Grade 5 Chapter 10 Lesson 12 My Homework Answer Key
Problem Solving
Question 1. Paul is decorating cupcakes for a birthday party. He can decorate \(\frac{3}{4}\) of a cupcake per minute. At this rate, how many cupcakes can he decorate in 12 minutes? Answer: The time is taken by paul to decorate 3/4 of a cupcake = 1 min The number of cupcakes he can decorate in 12 minutes = C for 3/4 th – 1 min for C – 12 min C x 1 = 3/4 x 12 C = 3 x 3 C = 9 Therefore, he can decorate 9 cupcakes in 12 minutes.
Question 2. Mathematical PRACTICE 4 Model Math To make cheesecake, you need about 2\(\frac{1}{2}\) pounds of cream cheese. How many pounds of cream cheese will you need to make 2 cheesecakes? Answer: The number of pounds of cream needed to make cheesecake = 2 1/2 = 5/2 pounds The number of pounds of cream cheese to make 2 cheesecakes = C 5/2 pounds – 1 cake C – 2 cakes C x 1 = 5/2 x 2 C = 5 Therefore, 5 pounds of cream cheese is needed.
Question 3. Scott viewed 72 classic cars at a car show. Of the cars he viewed, \(\frac{3}{8}\) were sports cars. How many sports cars did Scott view? Answer: The number of classic cars viewed by Scott = 72 The number of cars he viewed sport cars = 3/8 The number of sports = 3/8 x 72 The number of sports cars = 3 x 9 = 27 Therefore, he viewed 27 sports cars.
Question 4. Mathematical PRACTICE 5 Use Math Tools A builder is installing a fence on all four sides of a backyard. The yard is 40 feet long and 50 feet wide. How much fencing will the builder need? Answer: The number of feet for long = 40 The number of feet for wide = 50 for two sides = 40 + 40 = 80 (long) for two sides = 50 + 50 = 100 (wide) The builder needs = 80 + 100 = 180 feet.
Question 5. Misty purchased a pair of jeans that were originally $24 but was on sale for \(\frac{1}{3}\) off of the total price. How much did she save? Answer: The original amount of jeans Misty has purchased = 24 The offer = 1/3 of total price 1/3 of 24 1/3 x 24 1 x 8 = 8 Therefore, the amount she saved is $8.
Leave a Comment Cancel Reply
You must be logged in to post a comment.
IMAGES
VIDEO
COMMENTS
McGraw Hill My Math Grade 3 Chapter 13 Lesson 10 My Homework Answer Key. Problem Solving. Solve each problem by drawing a diagram. Question 1. Mathematical PRACTICE Model Math Martina and Charlotte are sharing a pizza. The pizza is cut into eight pieces. Martina ate a quarter of the pizza. Charlotte ate 3 pieces. How many pieces are left ...
Lesson 10: Angle Problems and Solving Equations. Student Outcomes. Students use vertical and adjacent angles and angles on a line and angles at a point in a multi-step problem to write and solve simple equations for an unknown angle in a figure. Related Topics: More Lesson Plans for Grade 7 Common Core Math. Lesson Notes.
Problem Solving. Draw Diagram. In mathematics, diagrams are often a useful way of organising information and help us to see relationships. A diagram can be a rough sketch, a number line, a tree diagram or two-way table, a Venn diagram, or any other drawing which helps us to tackle a problem. Labels (e.g. letters for vertices of a polygon) are ...
McGraw Hill 3rd Grade MyMath Chapter 13 Lesson 10 (Problem Solving: Draw a Diagram) ...
Lesson 10 Problem Solving: Draw a Diagram Homework Helper Need help? connectED.mcgraw-hill.com Gina's family built a deck in the shape of a hexagon. They placed posts on each outside corner. For a party, they will hang strings of decorative lights from each post to every other post. How many strings of lights are needed? Understand
Lesson 10: Angle Problems and Solving Equations Classwork Angle Facts and Definitions Name of Angle Relationship Angle Fact Diagram Adjacent Angles Vertical Angles (vert. ∠s) Angles on a Line ... Label the diagram with expressions that describe this relationship. Write an equation that models the angle relationship
DRAW A PICTURE/DIAGRAM/MODEL Drawing a picture/diagram/model is the most common problem solving strategy. Very often, students need to draw a picture/diagram/model just to understand the problem. The picture/diagram/model represents the problem in a way students can "see" it, understand it, and think about it while they look for the next step.
Using drawings to describe problems. Drawing strip diagrams is a process that actually begins in Kindergarten and 1st grade when students should be drawing pictures to represent word problems. Students should understand that the numbers in a problem represent something—pizzas, soccer players, apples, money saved—and their drawings should ...
Through the RDW process, the student would read and reread the problem, draw a tape diagram to help make sense of the information in the problem, solve the problem mathematically, write an answer statement, and then revisit the original problem to determine if his/her answer makes sense. Consider the following dialogue as a possible interaction ...
This download includes a PowerPoint with tips for solving problems involving the strategy ' draw a picture or diagram ' and eleven questions. Each slide contains a hyperlink to the answer, hyperlink back to the question and also a hyperlink to a hint and back.The same questions in the PowerPoint are also provided in task card form. A worksheet with similar questions is also included with ...
Most students will naturally draw pictures if given the slightest encouragement. Introduce a problem to students that will require them to draw a picture to solve. For example: Marah is putting up a tent for a family reunion. The tent is 16 feet by 5 feet. Each 4-foot section of tent needs a post except the sides that are 5 feet.
In this lesson students apply the concepts of trigonometry to two different situations. In the first, students need to interpret a diagram with limited information to find a way to calculate the dimensions of a polygon. In the second, students are given information about a plane's flight path, but they need to draw their own diagram as well ...
An Instructional Program. As primary students often have difficulty genera ting effective diagrams (Diezmann & English, 2001), an instructional program was developed to support students' use of ...
In this lesson, students will learn how to solve riddles to draw the correct diagram.
Solve the Problem PROBLEM SOLVING Lesson 10.5 Measurement and Data— 3.MD.A.1 Also 3.OA.D.8, 3.NBT.A.2 MATHEMATICAL PRACTICES MP1, MP3, MP4, MP6 ... Draw a diagram to help you explain your answer. Analyze Do you need to draw jumps on the number line in the same order as the times in the problem?
First two textbook examples in the McGraw-Hill, My Math Volume 2.Ch. 10 Multiply & Divide Fractions, Lesson 12 Problem Solving Investigation: Draw a Diagram
McGraw Hill My Math Grade 3 Chapter 10 Lesson 4 My Homework Answer Key. Problem Solving. Solve each problem by drawing a diagram. Question 1. Dalton ate 6 pieces of fruit on Monday. He ate 2 apples, 1 banana, 1 orange, and some apricots. What fraction of the fruit Dalton ate was apricots? Answer: Given that, Dalton ate 6 pieces of fruit on Monday.
The word ''diagram'' simply means a drawing or visual aid. In math, we use many types of diagrams. Venn Diagrams, bar graphs, basic drawings, pie charts, and tape diagrams are only a few of the ...
All the solutions provided in McGraw Hill Math Grade 5 Answer Key PDF Chapter 10 Lesson 12 Problem-Solving Investigation: Draw a Diagram will give you a clear idea of the concepts. McGraw-Hill My Math Grade 5 Answer Key Chapter 10 Lesson 12 Problem-Solving Investigation: Draw a Diagram. Learn the Strategy
This Problem-Solving Strategy: Draw a Diagram - Problem Solving 11.3 Organizer is suitable for 4th - 5th Grade. In this drawing a diagram to solve word problems worksheet, students practice the understand, plan, solve, and check technique for solving word problems by drawing diagrams. Students solve two word problems.
Find problem solving diagram lesson plans and teaching resources. Quickly find that inspire student learning. Search Search educational resources Search Menu ... In this drawing a diagram to solve word problems worksheet, students practice the understand, plan, solve, and check technique for solving word problems by drawing diagrams. ...
Problem Solving Strategy: Draw a picture. For Students 3rd - 4th. In this drawing a picture worksheet, students solve a math problem about a grocer stacking soup cans by drawing a picture. Students also answer 2 questions about how they solved it.
Worksheet Solving problems using Venn diagrams Qu 1-3 9-1 class textbook: p246 M8.7 Qu 1-6 (Look at Qu 2 and 5 in class) A*-G class textbook: No exercise 9-1 homework book: p84 M8.7 Qu 1-5 A*-G homework book: No exercise Summary When completing the Venn diagram, fill in the number in the overlap or outside the circles first.