Resources for Teaching Graph Making and Analysis Skills

How can you better develop graph and chart analytical skills with your students? One way is to have them explore and analyze graphs, then discuss what they have learned and think. Another is to create graphs. Let’s take a look at some ways you can do that.
Check out this Google Slides deck of Graphs, Correlation, and Causation . It can assist in teaching about how graphs and statistics can be used to mislead, an appropriate lesson for secondary students.

How to Teach What Graphs Mean
See the quote below for a common problem in classrooms. As a student, this quote reflects my experience with graph skills. And, from a teacher’s perspective, this is spot-on:
Last year, students frustrated me. They could graph lines and do the math. But, they didn’t understand what the graphs and equations meant.
I saw this when they couldn’t tell if answers were reasonable. They also couldn’t explain the graphs beyond the basics.
I knew I needed to get them thinking deeper about what the graphs show. That way the numbers would mean more. I wanted complex problems for them to spend more time on, doing more with fewer problems. (adapted for readability from source: Rachel at Idea Galaxy )
So, how do you teach graph skills? What graphs mean? What they represent? My answer? Focus on having students create graphs based on data they collect. Let’s take a look at some alternate approaches for analyzing graphs. Then, we will explore some digital tools for making graphs.
Teaching Students Graph Analysis Skills
There are many ways to analyze graphs that follow an approach like the one below:
- Read the title and make predictions about the graph.
- Read the axes and the labels and ask, “How are these related?”
- What is the relationship in the data and how does the data change?
- What units of measurements did the designer use?
- Study the data values to understand how big the differences shown are
Often, graph design is poor, and this affects students’ graph analysis skills. You have to work extra hard to ask questions that engage your mind. For some students, nothing pops into their mind when they look at a graph or chart, which makes teaching graph analysis and design important for critical thinking.
Guiding Questions for Graph Analysis Skills
Finally, I always dig into my back pocket for some questions . Here are a few that pop into my mind when I’m looking at a graph for the first time. They might be helpful when teaching students graph skills.
- What kind of graph is being used to represent data?
- Is that graph type the right one for the data? Why or why not?
- What colors did the graph designer use and do they mean anything?
- Why was this data chosen to present? What makes it special?
- What are some reasons for the differences in the data?
- What do I need to learn or understand better to see how and why this graph is important?
- How do I know this data is valid and reliable?
- What’s the proof or evidence?
- What is meant by this data?
- What does it symbolize?
- What does it mean for me? For others?
It never hurts to equip students with questions they can ask. Building a habit of graph analysis and design is the next step.
Resources for Analyzing Graphs and Charts
Here are some resources that provide background knowledge for graph and chart analysis:
- How to Write an IELTS Line Graph Essay
- Khan Academy Graph Interpretation (Algebra I)
- Graphs for Kids
- 1st Grade Bar Graphs
- Math Antics’ Data and Graphs
Tools for Making Graphs
Making graphs is one of my favorite ways to get students thinking and analyzing. I have a round up of five simple graphing tools you can explore , but here are two of my favorite graphing tools to teach graph making skills.
1. Kids’ Zone Create a Graph

This is one of my all time favorite graph creation tools. It’s easy to use via the web and works great on Chromebooks. It’s not too complicated! I’ve used it with third grade and sixth grade students.
2. Imgflip’s Chart Maker

This graph and chart-making tool is drop-dead easy. You can make pie, donut, or bar charts via your web browser. And you can change colors.
With those two powerful tools, you will have students designing graphs in no time. But wait, what kinds of graphs could you start with? What data sets could you use for teaching graph skills?
Additional Tools for Older Students:
- ChartBlocks
- Graph of the Week Template by Idea Galaxy
- Canva’s graph maker
Make Your Own Data Sets
Want to get students to graph data? Hands-on experiences and labs are one way to do that. You want students to recognize that graphable data surrounds them.

Here are some quick data sets and activities from various sources that can get your started with teaching graph analysis skills:
- Animals at the Zoo
- Bar Graphs, Line Plots
- Chores Bar Graphs and Pictographs
- Class Data Display
- Favorite colors
- Graphing Templates
- Hershey Kisses Toss (e.g. Desmos , Course Hero )
- Jelly bean data
- M&M Graphing Activity
- Skittles Sort and Count
- Spaghetti Marshmallow Tower Challenge (record height, spaghetti, and marshmallows used)
Graphs for Students to Analyze
Graphs and charts surround us. Let’s take a look at several graphs and charts you can use in the classroom.
1. Turner’s Graph of the Week (GOW)

Kelly Turner’s Graph of the Week website wants to help students become “lifelong critical and analytical thinkers.” They also hope to achieve the following:
- Improve academic literacy
- Develop students engaged in civics through oral discourse
- Link mathematics to real-world situations
- Develop students’ Habits of Mind
- Improve written communication
- Give students current events awareness
You will find a very long list with a variety of graphs to analyze for the current school year and in the 2013-last school year’s archive . Don’t be afraid to make your own! This is a great resource for teaching and reviewing graph analysis skills.
2. Using Graphs for Writing to Learn
This particular collection (view-only link) is available as a Google Doc of instructions (make-a-copy link). Find it via MiddleWeb ‘ s blog . It offers specific suggestions, such as:
- Give the title of the graph.
- Describe the picture/shape of graph.
- Summarize the information given in the graph.
- Give statistics and results included in the graph.
- State the source of the information.
- Give your opinion of the results.
- Explain how the information relates to you or the world around you
Students then review a series of graphs and charts. They follow the instructions included to write about it. Then, as an extension activity, they create an infographic of their data. Great way to put graph anaylsis and making skills into practice! You can get some more ideas about infographics from these TechNotes articles .
3. Next Graphs + Charts

This website encourages students to become graph graphic designers. With that goal in mind, you will find seven activities to assist you with teaching students graph design skills. A short list of the activities appears below:
- Activity 1 – collect charts and graphs
- Activity 2 – parts of graphs and charts
- Activity 3 – direct a pie chart
- Activity 4 – build a bar chart
- Activity 5 – area graphs
- Activity 6 – point plots
- Activity 7 – variables
- Activity 8 – identify and interpret
At the end, students can take a short quiz about key concepts. This is a valuable resource that provides a lot of great ideas and suggestions. The information is bite-sized, so your students won’t be overwhelmed with information.
What’s more, you will find pages of information on topics including area, coding, diagramming, grids, temperature, and more.
4. Problem-Attic

Looking for incredible graphs aligned to curricular concepts? Explore Problem-Attic . You get access to a question bank with 280,000 questions, and it offers many more features. One feature I like is you can search for graphs, then export quizzes to your learning management system of choice (e.g. Schoology , Canvas , Google Forms Quiz , etc.). Or you can create a slideshow with instant feedback via QR code and website.
5. Tuva Labs Content Library

Tuva Labs offers a rich collection of graphs and content you can use in your science class for teaching analysis skills. Their searchable content library, which includes both free and premium offerings, has rich content resources.
Some graph relevant links include the following:
- Zoom in On Beach Trash
- Be Specific with Your Heat
- Alike and Different: Where Did the Dinosaurs Roam?
AI Graph Makers
Once you’ve had a chance to work with graph reading, analysis, and design, check out these AI tools. These AI graph makers can certainly help:
- GraphMaker.ai
- AppyPie AI Graph Maker
- Fotor Online Graph Maker
- Taskade AI Knowledge Graph Generator
Give these a shot later on when students are comfortable with their skills reading and analyzing graphs.
If you’re wanting to get up to speed on better analysis of graphs before working with your students, here is a great video for you:
Now that you have a wealth of tools, remember, it’s about getting students to analyze the graph, ask tough questions about the data the graph is based on, and why it matters.

Miguel Guhlin
Transforming teaching, learning and leadership through the strategic application of technology has been Miguel Guhlin’s motto. Learn more about his work online at blog.tcea.org , mguhlin.org , and mglead.org /mglead2.org. Catch him on Mastodon @[email protected] Areas of interest flow from his experiences as a district technology administrator, regional education specialist, and classroom educator in bilingual/ESL situations. Learn more about his credentials online at mguhlin.net.
Three Resources for Real-World Classroom Connections
Three ways to prime adults for professional learning, you may also like, blast off into learning: celebrate national astronaut day, digital reading tools for k-5 readers, three ai tools for literacy instruction, earth day ideas to inspire young eco-heroes, four solar eclipse-themed activities, the middle school elar teks and free, editable..., the new k-5 science teks and free, editable..., friendship quilts bring history, math, and sel together, high-dosage tutoring: a research-backed math intervention, science activities for critical thinking, leave a comment cancel reply.
Save my name, email, and website in this browser for the next time I comment.
You've Made It This Far
Like what you're reading? Sign up to stay connected with us.
*By downloading, you are subscribing to our email list which includes our daily blog straight to your inbox and marketing emails. It can take up to 7 days for you to be added. You can change your preferences at any time.
You have Successfully Subscribed!
By subscribing, you will receive our daily blog, newsletter, and marketing emails.
- Public Maps
Not logged in. Sign in or Create an account .
Better thinking, clearer writing
Learn to think critically and write well with rationale.
- Structure arguments
- Analyse reasoning
- Identify assumptions
- Evaluate evidence

Subscription / Code
education.
- Create an account first
- Register your license code
- Upgrade your account
- View plans & pricing
- View plans & pricing Education
- Rationale Help/FAQ
- Rationale Guide
- Rationale Tutorials
- Rationale WIKI
Editor's Pick
Learn more...
- Rationale & critical thinking
- Teaching Critical Thinking with Rationale
- Developing critical thinking skills: resear...
- Training & workshops
- Portal Critical Thinking on the Web
How-to videos
how-to video’s.
- My first map
- Essay planning

- Share full article
Advertisement
Supported by
What's Going On in This Graph?
What’s Going On in This Graph? | March 20, 2019
By The Learning Network
- March 14, 2019
Updated: Mar. 21, 2019
1. This graph, which originally appeared in The New York Times, shows more than 500 jobs, their required skills and how likely they are to be automatable. You can enter a job in the “Find a job ...” field to find where it is on the graph. You can also hover the cursor over a job title to find more information. On March 21, we will provide additional background about the graph as well as relevant statistical concepts.
After looking closely at the graph above, think about these three questions:
• What do you notice? • What do you wonder? What are you curious about that comes from what you notice in the graph? • What might be going on in this graph? Write a catchy headline that captures the graph’s main idea. If your headline makes a claim, tell us what you noticed that supports your claim.
The questions are intended to build on one another, so try to answer them in order. Start with “I notice,” then “I wonder,” and end with “The story this graph is telling is ….” and a catchy headline.
2. Next, join the conversation by clicking on the comment button and posting in the box that opens on the right. (Students 13 and older are invited to comment, although teachers of younger students are welcome to post what their students have to say or they can have their students use this same activity on Desmos .)
3. After you have posted, read what others have said, then respond to someone else by posting a comment. Use the “Reply” button or the @ symbol to address that student directly.
On Wednesday, March 20, our collaborator, the American Statistical Association , will facilitate this discussion from 9 a.m. to 2 p.m. Eastern Time to help students’ understanding go deeper. You might use their responses as models for your own.
4. On the afternoon of Thursday, March 21, we will reveal more information about the graph at the bottom of this post. Students, we encourage you to post an additional comment after reading the reveal. How does the original New York Times article and the moderators’ comments help you see the graph differently? Try to incorporate the statistical terms defined in the Stat Nuggets in your response.
• Read our introductory post , which includes information about using the “ Notice and Wonder ” teaching strategy. • Learn about how and why other teachers are using this feature, and use the 2018-19 “What’s Going On in This Graph?” calendar to plan ahead for the 25 Wednesday releases. • Go to the A.S.A. K-12 website , which includes This is Statistics , resources, professional development, student competitions, curriculum, courses and careers.
Do you have an idea of what job you are interested in? What skills or interests would you need for this job? This scatterplot, provided by the U.S. Department of Labor, shows the skill characteristics of about 550 jobs and how likely they are to be automatable. Notice where the “green” (least likely to be automated) jobs are and where the “purple” (most likely to be automated) jobs are. What does this tell us about the job market? To explore jobs, enter a job in the “Find a job…” field to see where it is on the graph. You can also hover the cursor over a job to find more information. Or, decide what characteristics fit you best on these two continua — from communicating with critical thinking to physical work and operating machines to processes and service work. Then, examine the jobs with these characteristics.
This graph appeared in the July 27, 2017 New York Times Upshot article “ Old Skills, New Careers: Workers in Fading Jobs Often Already Have What it Takes to Succeed in Growing Ones .” The article’s focus was on how workers who lost their jobs to automation leveraged their skills with some specialized training to go into complete different fields. Often this training involved computer skills, sometimes paid for by new employers. With money, effort and the political will, a transition can be made to 21st century jobs.
It is important to know which jobs are least likely to be eliminated as robots and automation replace workers. If the job you are interested in is likely to be automatable, then find other jobs on the graph that have similar characteristics. An interactive table toward the end of the article allows you to specify a job and click to get two lists: jobs that have the most and least overlap in skills with your selected job. Also, use the O*NET tools (see below) to inform you about career choices.
You may want to think critically about these additional questions.
• Notice the location on the graph of “green” jobs and of “purple” jobs. What is the story about where on the graph the “green” and the “purple” jobs are? What labor market story does this tell?
• An alternative to a long, written story about a topic is a graph that incorporates large datasets. It can clearly and quickly reveal a story. Let’s see how large this graph’s dataset is.
There are about 550 jobs shown on this graph. Each job has three variables in this scatterplot. What are they? Each job also has three characteristics listed when you click on the job. What are they? Each characteristic is based on 161 different skills. With all of these jobs and their variables, characteristics and skills, about how many data items does this dataset incorporate into this graph?
• So you want to be a ( you fill your job of choice ). Go to the middle of the article and see a table where you enter your preferred job and see which other jobs have the most and least skills that overlap with your preferred job. Then, note for these jobs which are most (or least) likely to be automatable. O*NET database shows how much overlap there is between many seemingly dissimilar occupations. To find out how your interests relate to occupations, go to the O*NET Interest Profiler . By responding to 60 very brief questions, the site will generate a list of careers that may meet your interests. Then use the website to learn more about the training you will need.
• There are many other resources on the O*NET website. For example, we searched for graphic designer and found lists of needed skills, education, work styles, wages and job openings. Peruse the website to research a career that interests you. Other interesting sections of the site include apprenticeships and “ hot technologies .”
Below in the Stat Nuggets, we define and explain mathematical terms that apply to these graphs. Look into the archives to see past Stat Nuggets.
Thank you for participating in “What’s Going On in This Graph?” which is intended to help you think more critically about graphs and the underlying data. Critical thinking is an essential element of statistics, the science of learning from data. Data visualizations, like these graphs, are an important part of statistics. They help us to understand and learn from data.
Keep noticing and wondering. We continue to welcome your responses.
Join us Wednesday, April 3 to notice and wonder about when spring springs with life; online moderation will take place between 9 a.m. - 2 p.m. E.T. The graph will be released on Thursday, March 28.
Stat Nuggets for “Old Skills, New Career”
SCATTERPLOT
A scatterplot is a graph that is used to display the relationship between two quantitative variables and is described by its direction, strength, form and unusual observations.
Direction: A positive direction means that the y-variable tends to increase as the x-variable increases (or a downhill trend). A negative direction means that the y-variable tends to decrease as the x-variable increases (or an uphill trend). Scatterplots are said to have no direction when the two variables seem to have no consistent positive or negative relationship.
Strength: A scatterplot is strong if the points fall in a “tight” pattern and weak if they are spread out.
Form: Form is the pattern the points make. The most common forms are linear, curved and scattered.
Unusual observations: Unusual points do not fit the general trend of the scatterplot. They may be outliers.
In the jobs and skills graph, the two quantitative variables are the range of job skills from more emphasis on operating machines and processes to clerical and service work (vertical axis, y-axis) and from more emphasis on communication and critical thinking to physical work (horizontal axis, x-axis). The graph is scattered with no direction. The strength is weak. The most unusual jobs are airline pilots, surgeons and physicists who require communication and critical thinking skills and operate machines or processes. Their jobs are less likely to be automated.
The graphs for “What’s Going On in This Graph?” are selected in partnership with Sharon Hessney, a mathematics teacher in Boston. Ms. Hessney wrote the “reveal” and Stat Nuggets. Erica Chauvet and James Bush, both professors at Waynesburg University in Pennsylvania, edited the reveal and moderated, respectively.
Critical Thinking Definition, Skills, and Examples
- Homework Help
- Private School
- College Admissions
- College Life
- Graduate School
- Business School
- Distance Learning
:max_bytes(150000):strip_icc():format(webp)/ADHeadshot-Cropped-b80e40469d5b4852a68f94ad69d6e8bd.jpg "critical thinking graph")
- Indiana University, Bloomington
- State University of New York at Oneonta
Critical thinking refers to the ability to analyze information objectively and make a reasoned judgment. It involves the evaluation of sources, such as data, facts, observable phenomena, and research findings.
Good critical thinkers can draw reasonable conclusions from a set of information, and discriminate between useful and less useful details to solve problems or make decisions. Employers prioritize the ability to think critically—find out why, plus see how you can demonstrate that you have this ability throughout the job application process.
Why Do Employers Value Critical Thinking Skills?
Employers want job candidates who can evaluate a situation using logical thought and offer the best solution.
Someone with critical thinking skills can be trusted to make decisions independently, and will not need constant handholding.
Hiring a critical thinker means that micromanaging won't be required. Critical thinking abilities are among the most sought-after skills in almost every industry and workplace. You can demonstrate critical thinking by using related keywords in your resume and cover letter, and during your interview.
Examples of Critical Thinking
The circumstances that demand critical thinking vary from industry to industry. Some examples include:
- A triage nurse analyzes the cases at hand and decides the order by which the patients should be treated.
- A plumber evaluates the materials that would best suit a particular job.
- An attorney reviews evidence and devises a strategy to win a case or to decide whether to settle out of court.
- A manager analyzes customer feedback forms and uses this information to develop a customer service training session for employees.
Promote Your Skills in Your Job Search
If critical thinking is a key phrase in the job listings you are applying for, be sure to emphasize your critical thinking skills throughout your job search.
Add Keywords to Your Resume
You can use critical thinking keywords (analytical, problem solving, creativity, etc.) in your resume. When describing your work history , include top critical thinking skills that accurately describe you. You can also include them in your resume summary , if you have one.
For example, your summary might read, “Marketing Associate with five years of experience in project management. Skilled in conducting thorough market research and competitor analysis to assess market trends and client needs, and to develop appropriate acquisition tactics.”
Mention Skills in Your Cover Letter
Include these critical thinking skills in your cover letter. In the body of your letter, mention one or two of these skills, and give specific examples of times when you have demonstrated them at work. Think about times when you had to analyze or evaluate materials to solve a problem.
Show the Interviewer Your Skills
You can use these skill words in an interview. Discuss a time when you were faced with a particular problem or challenge at work and explain how you applied critical thinking to solve it.
Some interviewers will give you a hypothetical scenario or problem, and ask you to use critical thinking skills to solve it. In this case, explain your thought process thoroughly to the interviewer. He or she is typically more focused on how you arrive at your solution rather than the solution itself. The interviewer wants to see you analyze and evaluate (key parts of critical thinking) the given scenario or problem.
Of course, each job will require different skills and experiences, so make sure you read the job description carefully and focus on the skills listed by the employer.
Top Critical Thinking Skills
Keep these in-demand critical thinking skills in mind as you update your resume and write your cover letter. As you've seen, you can also emphasize them at other points throughout the application process, such as your interview.
Part of critical thinking is the ability to carefully examine something, whether it is a problem, a set of data, or a text. People with analytical skills can examine information, understand what it means, and properly explain to others the implications of that information.
- Asking Thoughtful Questions
- Data Analysis
- Interpretation
- Questioning Evidence
- Recognizing Patterns
Communication
Often, you will need to share your conclusions with your employers or with a group of colleagues. You need to be able to communicate with others to share your ideas effectively. You might also need to engage in critical thinking in a group. In this case, you will need to work with others and communicate effectively to figure out solutions to complex problems.
- Active Listening
- Collaboration
- Explanation
- Interpersonal
- Presentation
- Verbal Communication
- Written Communication
Critical thinking often involves creativity and innovation. You might need to spot patterns in the information you are looking at or come up with a solution that no one else has thought of before. All of this involves a creative eye that can take a different approach from all other approaches.
- Flexibility
- Conceptualization
- Imagination
- Drawing Connections
- Synthesizing
Open-Mindedness
To think critically, you need to be able to put aside any assumptions or judgments and merely analyze the information you receive. You need to be objective, evaluating ideas without bias.
- Objectivity
- Observation
Problem Solving
Problem-solving is another critical thinking skill that involves analyzing a problem, generating and implementing a solution, and assessing the success of the plan. Employers don’t simply want employees who can think about information critically. They also need to be able to come up with practical solutions.
- Attention to Detail
- Clarification
- Decision Making
- Groundedness
- Identifying Patterns
More Critical Thinking Skills
- Inductive Reasoning
- Deductive Reasoning
- Noticing Outliers
- Adaptability
- Emotional Intelligence
- Brainstorming
- Optimization
- Restructuring
- Integration
- Strategic Planning
- Project Management
- Ongoing Improvement
- Causal Relationships
- Case Analysis
- Diagnostics
- SWOT Analysis
- Business Intelligence
- Quantitative Data Management
- Qualitative Data Management
- Risk Management
- Scientific Method
- Consumer Behavior
Key Takeaways
- Demonstrate that you have critical thinking skills by adding relevant keywords to your resume.
- Mention pertinent critical thinking skills in your cover letter, too, and include an example of a time when you demonstrated them at work.
- Finally, highlight critical thinking skills during your interview. For instance, you might discuss a time when you were faced with a challenge at work and explain how you applied critical thinking skills to solve it.
University of Louisville. " What is Critical Thinking ."
American Management Association. " AMA Critical Skills Survey: Workers Need Higher Level Skills to Succeed in the 21st Century ."
- Critical Thinking in Reading and Composition
- Bloom's Taxonomy in the Classroom
- Introduction to Critical Thinking
- How To Become an Effective Problem Solver
- Creativity & Creative Thinking
- Higher-Order Thinking Skills (HOTS) in Education
- 2020-21 Common Application Essay Option 4—Solving a Problem
- 6 Skills Students Need to Succeed in Social Studies Classes
- College Interview Tips: "Tell Me About a Challenge You Overcame"
- Types of Medical School Interviews and What to Expect
- The Horse Problem: A Math Challenge
- What to Do When the Technology Fails in Class
- What Are Your Strengths and Weaknesses? Interview Tips for Teachers
- A Guide to Business Letters Types
- How to Practice Critical Thinking in 4 Steps
- Landing Your First Teaching Job

How it works
For Business
Join Mind Tools
Infographic • 4 min read
An Elementary Guide to Critical Thinking Infographic
Infographic transcript.
By the Mind Tools Content Team
View Full Infographic by Clicking Here

You've accessed 1 of your 2 free resources.
Get unlimited access
Discover more content
Data security in your team.
Protecting Your Electronic and Online Assets
Jain and Sharma's BADIR Framework
Extracting Information From Data, Intelligently
Add comment
Comments (0)
Be the first to comment!

Try Mind Tools for FREE
Get unlimited access to all our career-boosting content and member benefits with our 7-day free trial.
Sign-up to our newsletter
Subscribing to the Mind Tools newsletter will keep you up-to-date with our latest updates and newest resources.
Subscribe now
Business Skills
Personal Development
Leadership and Management
Member Extras
Most Popular
Newest Releases

Team Briefings

Onboarding With STEPS
Mind Tools Store
About Mind Tools Content
Discover something new today
New pain points podcast - perfectionism.
Why Am I Such a Perfectionist?
Pain Points Podcast - Building Trust
Developing and Strengthening Trust at Work
How Emotionally Intelligent Are You?
Boosting Your People Skills
Self-Assessment
What's Your Leadership Style?
Learn About the Strengths and Weaknesses of the Way You Like to Lead
Recommended for you
Constructive controversy.
Improving Solutions by Arguing For and Against Your Options
Business Operations and Process Management
Strategy Tools
Customer Service
Business Ethics and Values
Handling Information and Data
Project Management
Knowledge Management
Self-Development and Goal Setting
Time Management
Presentation Skills
Learning Skills
Career Skills
Communication Skills
Negotiation, Persuasion and Influence
Working With Others
Difficult Conversations
Creativity Tools
Self-Management
Work-Life Balance
Stress Management and Wellbeing
Coaching and Mentoring
Change Management
Team Management
Managing Conflict
Delegation and Empowerment
Performance Management
Leadership Skills
Developing Your Team
Talent Management
Problem Solving
Decision Making
Member Podcast
Advertisement
Thinking critically about critical thinking dispositions in technology education
- Published: 05 February 2020
- Volume 31 , pages 465–488, ( 2021 )
Cite this article

- Willem Rauscher ORCID: orcid.org/0000-0001-5741-160X 1 &
- Hendri Badenhorst 1
1443 Accesses
3 Citations
Explore all metrics
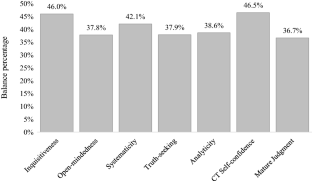
While much research has been done on Critical Thinking (CT) skills, the disposition toward CT has not been adequately investigated. The paucity of literature regarding technology teachers’ disposition toward CT is particularly problematic as these teachers have to assist learners with the designing and making of solutions (artefacts) to problems that are often ill structured. Solving these problems is complicated and involves critical thinking. Helping learners to find solutions to these problems, therefore, requires teachers to be willing to think critically and encourage critical thinking in the classroom. Profiling these teachers’ dispositions could reveal their inclination to employ critical thinking, and give an indication of the likelihood that they may foster CT skills and the disposition toward CT in the classroom. In addition, such profiling could provide a descriptive baseline for further investigation into the relationship that seems to exist between CT dispositions and professions. This study, therefore, aimed to investigate technology teachers’ disposition to think critically in terms of their habits of mind. Quantitative research, using an online survey, was employed in this study. A Likert Scale instrument comprising 42 statements, derived from Facione’s (Informal Log 20(1): 61–84, 2000 ) seven habits of mind, was administered to South African technology teachers. The participants had to rate their level of agreement with each statement on a six-point scale. The research findings revealed that this sample had a positive disposition toward CT. The habits of mind that ranked the strongest were CT Self-confidence and Inquisitiveness, while Mature Judgment ranked the weakest (although still in a positive direction). Further research is needed to establish which dispositions should be emphasised in order to address the dispositional needs in technology education.
This is a preview of subscription content, log in via an institution to check access.
Access this article
Price includes VAT (Russian Federation)
Instant access to the full article PDF.
Rent this article via DeepDyve
Institutional subscriptions
Strategies for fostering critical thinking dispositions in the technology classroom

Critical Thinking in Postgraduate Degree Work at the Israel Technological University, Ecuador

Teaching Critical Thinking– A Task-Based Approach: Work in Progress
American Philosophical Association. (1990). Critical thinking: A statement of expert consensus for purposes of educational assessment and instruction . Recommendations prepared for the committee on pre - college philosophy . California State University, Fullerton. ERIC Doc. No. ED 315-423.
Ary, D., Jacobs, L. C., & Sorensen, C. (2010). Introduction to research in education . Belmont: Wadsworth.
Google Scholar
Beyer, B. (1990). What philosophy offers to the teaching of thinking. Educational Leadership, 47 (5), 55–60.
Binkley, M., Erstad, O., Herman, J., Raizen, S., Ripley, M., Miller-Ricci, M., et al. (2012). Defining twenty-first century skills. In P. Griffin, B. McGaw, & E. Care (Eds.), Assessment and teaching of 21st century skills . Dordrecht: Springer.
Department of Basic Education. (2011). National curriculum statement: Curriculum and assessment policy statement (CAPS) . Technology Grades 7–9. Pretoria: Government Printing Works.
Dewey, J. (1910). How we think . Boston: D.C. Heath & Co.
Book Google Scholar
Dwyer, C. P., Hogan, M. J., Harney, O. M., & Kavanagh, C. (2017). Facilitating a student-educator conceptual model of dispositions towards critical thinking through interactive management. Educational Technology Research and Development, 65, 47–73.
Article Google Scholar
Dwyer, C. P., Hogan, M. J., & Stewart, I. (2015). The effects of argument mapping-infused critical thinking instruction on reflective judgement. Thinking Skills and Creativity, 16, 11–26.
Ennis, R. (1996). Critical thinking dispositions: Their nature and assessability. Informal Logic, 18 (2), 165–182.
Ennis, R. (2018). Critical thinking across the curriculum: A vision. Topoi: An International Review of Philosophy, 37 (1), 165–184.
Facione, P. A. (1990). The delphi report: Executive summary; critical thinking: A statement of expert consensus for purposes of educational assessment and instruction . California: California Academic Press.
Facione, P. A. (2000). The disposition toward critical thinking: Its character, measurement, and relationship to critical chinking skill. Informal Logic, 20 (1), 61–84.
Facione, P. A. (2015). Critical thinking: What it is and why it counts (pp. 1–30). Insight Assessment.
Facione, P. A., Sánchez, C. A., Facione, N. C., & Gainen, J. (1995). The disposition toward critical thinking. The Journal of General Education, 44 (1), 1–25.
Field, A. (2009). Discovering statistics using SPSS (3rd ed.). London: Sage Publications Ltd.
Halpern, D. F. (2014). Thought and knowledge: An introduction to critical thinking (5th ed.). New York: Psychology Press.
Jonassen, D. H. (1997). Instructional design models for well-structured and iII-structured problem-solving learning outcomes. Educational Technology Research and Development, 45 (1), 65–94.
Jonsson, A., & Lindén, S. (2009). The quest for the best consumer confidence indicator. European economy - economic papers (Vol. 372). Brussels: European Commission Directorate-General for Economic and Financial Affairs.
Mcbride, R. E., Xiang, P., & Wittenburg, D. (2002). Dispositions toward critical thinking: the preservice teacher’s perspective. Teachers and Teaching: Theory and Practice, 8 (1), 29–40.
Paul, R. W. (1995). Critical thinking: How to prepare students for a rapidly changing world . Santa Rosa, CA: Foundation for Critical Thinking.
Paul, R. W. (2012). Critical thinking: What every person needs to survive in a rapidly changing world (4th ed.). Tomales, CA: Foundation for Critical Thinking.
Perkins, D., Jay, E., & Tishman, S. (1993). Beyond abilities: A dispositional theory of thinking. Merrill-Palmer Quarterly, 39 (1), 1–21.
Schooner, P., Nordlöf, C., Klasander, C., & Hallström, J. (2017). Design, system, value: The role of problem-solving and critical thinking capabilities in technology education, as perceived by teachers. Design and Technology Education: An International Journal, 22, 60–75.
Siegel, H. (1999). What (good) are thinking dispositions? Educational Theory, 49 (2), 207–221.
Trilling, B., & Fadel, C. (2009). 21st century skills: Learning for life in our times . San Francisco, CA: Jossey-Bass.
Van Niekerk, E., Ankiewicz, P., & De Swart, E. (2010). A process-based assessment framework for technology education: A case study. International Journal of Technology and Design Education, 20 (2), 191–215.
Watson, L. (2015). What is inquisitiveness. American Philosophical Quarterly, 52 (3), 273–287.
Wright, K. B. (2005). Researching Internet-based populations: Advantages and disadvantages of online survey research, online questionnaire authoring software packages, and web survey services. Journal of Computer-Mediated Communication, 10 (3). https://doi.org/10.1111/j.1083-6101.2005.tb00259.x .
Download references
This publication was produced with support from the Teaching and Learning Development Capacity Improvement Programme, a partnership programme between the Department of Higher Education and Training and the European Union. Its contents are the sole responsibility of the authors and do not necessarily reflect the views of the Department or the European Union.
Author information
Authors and affiliations.
Department of Science, Mathematics and Technology Education, Faculty of Education, University of Pretoria, Pretoria, South Africa
Willem Rauscher & Hendri Badenhorst
You can also search for this author in PubMed Google Scholar
Corresponding author
Correspondence to Willem Rauscher .
Additional information
Publisher's note.
Springer Nature remains neutral with regard to jurisdictional claims in published maps and institutional affiliations.
Rights and permissions
Reprints and permissions
About this article
Rauscher, W., Badenhorst, H. Thinking critically about critical thinking dispositions in technology education. Int J Technol Des Educ 31 , 465–488 (2021). https://doi.org/10.1007/s10798-020-09564-3
Download citation
Accepted : 29 January 2020
Published : 05 February 2020
Issue Date : July 2021
DOI : https://doi.org/10.1007/s10798-020-09564-3
Share this article
Anyone you share the following link with will be able to read this content:
Sorry, a shareable link is not currently available for this article.
Provided by the Springer Nature SharedIt content-sharing initiative
- Critical thinking
- Disposition
- Habits of mind
- Technology education
- Find a journal
- Publish with us
- Track your research
- Departments, units, and programs
- College leadership
- Diversity, equity, and inclusion
- Faculty and staff resources
- LAS Strategic Plan

- Apply to LAS
- Liberal arts & sciences majors
- LAS Insider blog
- Admissions FAQs
- Parent resources
- Pre-college summer programs
Quick Links
Request info
- Academic policies and standing
- Advising and support
- College distinctions
- Dates and deadlines
- Intercollegiate transfers
- LAS Lineup student newsletter
- Programs of study
- Scholarships
- Certificates
- Student emergencies
Student resources
- Access and Achievement Program
- Career services
- First-Year Experience
- Honors program
- International programs
- Internship opportunities
- Paul M. Lisnek LAS Hub
- Student research opportunities
- Expertise in LAS
- Research facilities and centers
- Dean's Distinguished Lecture series
- Alumni advice
- Alumni award programs
- Get involved
- LAS Alumni Council
- LAS@Work: Alumni careers
- Study Abroad Alumni Networks
- Update your information
- Nominate an alumnus for an LAS award
- Faculty honors
- The Quadrangle Online
- LAS News email newsletter archive
- LAS social media
- Media contact in the College of LAS
- LAS Landmark Day of Giving
- About giving to LAS
- Building projects
- Corporate engagement
- Faculty support
- Lincoln Scholars Initiative
- Impact of giving
Why is critical thinking important?
What do lawyers, accountants, teachers, and doctors all have in common?

What is critical thinking?
The Oxford English Dictionary defines critical thinking as “The objective, systematic, and rational analysis and evaluation of factual evidence in order to form a judgment on a subject, issue, etc.” Critical thinking involves the use of logic and reasoning to evaluate available facts and/or evidence to come to a conclusion about a certain subject or topic. We use critical thinking every day, from decision-making to problem-solving, in addition to thinking critically in an academic context!
Why is critical thinking important for academic success?
You may be asking “why is critical thinking important for students?” Critical thinking appears in a diverse set of disciplines and impacts students’ learning every day, regardless of major.
Critical thinking skills are often associated with the value of studying the humanities. In majors such as English, students will be presented with a certain text—whether it’s a novel, short story, essay, or even film—and will have to use textual evidence to make an argument and then defend their argument about what they’ve read. However, the importance of critical thinking does not only apply to the humanities. In the social sciences, an economics major , for example, will use what they’ve learned to figure out solutions to issues as varied as land and other natural resource use, to how much people should work, to how to develop human capital through education. Problem-solving and critical thinking go hand in hand. Biology is a popular major within LAS, and graduates of the biology program often pursue careers in the medical sciences. Doctors use critical thinking every day, tapping into the knowledge they acquired from studying the biological sciences to diagnose and treat different diseases and ailments.
Students in the College of LAS take many courses that require critical thinking before they graduate. You may be asked in an Economics class to use statistical data analysis to evaluate the impact on home improvement spending when the Fed increases interest rates (read more about real-world experience with Datathon ). If you’ve ever been asked “How often do you think about the Roman Empire?”, you may find yourself thinking about the Roman Empire more than you thought—maybe in an English course, where you’ll use text from Shakespeare’s Antony and Cleopatra to make an argument about Roman imperial desire. No matter what the context is, critical thinking will be involved in your academic life and can take form in many different ways.
The benefits of critical thinking in everyday life
Building better communication.
One of the most important life skills that students learn as early as elementary school is how to give a presentation. Many classes require students to give presentations, because being well-spoken is a key skill in effective communication. This is where critical thinking benefits come into play: using the skills you’ve learned, you’ll be able to gather the information needed for your presentation, narrow down what information is most relevant, and communicate it in an engaging way.
Typically, the first step in creating a presentation is choosing a topic. For example, your professor might assign a presentation on the Gilded Age and provide a list of figures from the 1870s—1890s to choose from. You’ll use your critical thinking skills to narrow down your choices. You may ask yourself:
- What figure am I most familiar with?
- Who am I most interested in?
- Will I have to do additional research?
After choosing your topic, your professor will usually ask a guiding question to help you form a thesis: an argument that is backed up with evidence. Critical thinking benefits this process by allowing you to focus on the information that is most relevant in support of your argument. By focusing on the strongest evidence, you will communicate your thesis clearly.
Finally, once you’ve finished gathering information, you will begin putting your presentation together. Creating a presentation requires a balance of text and visuals. Graphs and tables are popular visuals in STEM-based projects, but digital images and graphics are effective as well. Critical thinking benefits this process because the right images and visuals create a more dynamic experience for the audience, giving them the opportunity to engage with the material.
Presentation skills go beyond the classroom. Students at the University of Illinois will often participate in summer internships to get professional experience before graduation. Many summer interns are required to present about their experience and what they learned at the end of the internship. Jobs frequently also require employees to create presentations of some kind—whether it’s an advertising pitch to win an account from a potential client, or quarterly reporting, giving a presentation is a life skill that directly relates to critical thinking.
Fostering independence and confidence
An important life skill many people start learning as college students and then finessing once they enter the “adult world” is how to budget. There will be many different expenses to keep track of, including rent, bills, car payments, and groceries, just to name a few! After developing your critical thinking skills, you’ll put them to use to consider your salary and budget your expenses accordingly. Here’s an example:
- You earn a salary of $75,000 a year. Assume all amounts are before taxes.
- 1,800 x 12 = 21,600
- 75,000 – 21,600 = 53,400
- This leaves you with $53,400
- 320 x 12 = 3,840 a year
- 53,400-3,840= 49,560
- 726 x 12 = 8,712
- 49,560 – 8,712= 40,848
- You’re left with $40,848 for miscellaneous expenses. You use your critical thinking skills to decide what to do with your $40,848. You think ahead towards your retirement and decide to put $500 a month into a Roth IRA, leaving $34,848. Since you love coffee, you try to figure out if you can afford a daily coffee run. On average, a cup of coffee will cost you $7. 7 x 365 = $2,555 a year for coffee. 34,848 – 2,555 = 32,293
- You have $32,293 left. You will use your critical thinking skills to figure out how much you would want to put into savings, how much you want to save to treat yourself from time to time, and how much you want to put aside for emergency funds. With the benefits of critical thinking, you will be well-equipped to budget your lifestyle once you enter the working world.
Enhancing decision-making skills
Choosing the right university for you.
One of the biggest decisions you’ll make in your life is what college or university to go to. There are many factors to consider when making this decision, and critical thinking importance will come into play when determining these factors.
Many high school seniors apply to colleges with the hope of being accepted into a certain program, whether it’s biology, psychology, political science, English, or something else entirely. Some students apply with certain schools in mind due to overall rankings. Students also consider the campus a school is set in. While some universities such as the University of Illinois are nestled within college towns, New York University is right in Manhattan, in a big city setting. Some students dream of going to large universities, and other students prefer smaller schools. The diversity of a university’s student body is also a key consideration. For many 17- and 18-year-olds, college is a time to meet peers from diverse racial and socio-economic backgrounds and learn about life experiences different than one’s own.
With all these factors in mind, you’ll use critical thinking to decide which are most important to you—and which school is the right fit for you.
Develop your critical thinking skills at the University of Illinois
At the University of Illinois, not only will you learn how to think critically, but you will put critical thinking into practice. In the College of LAS, you can choose from 70+ majors where you will learn the importance and benefits of critical thinking skills. The College of Liberal Arts & Sciences at U of I offers a wide range of undergraduate and graduate programs in life, physical, and mathematical sciences; humanities; and social and behavioral sciences. No matter which program you choose, you will develop critical thinking skills as you go through your courses in the major of your choice. And in those courses, the first question your professors may ask you is, “What is the goal of critical thinking?” You will be able to respond with confidence that the goal of critical thinking is to help shape people into more informed, more thoughtful members of society.
With such a vast representation of disciplines, an education in the College of LAS will prepare you for a career where you will apply critical thinking skills to real life, both in and outside of the classroom, from your undergraduate experience to your professional career. If you’re interested in becoming a part of a diverse set of students and developing skills for lifelong success, apply to LAS today!
Read more first-hand stories from our amazing students at the LAS Insider blog .
- Privacy Notice
- Accessibility
- Try for free
Numbers and Graphing: Critical Thinking (Gr. 2)
Scott Foresman, an imprint of Pearson
Featured 2nd grade resources.

Related Resources
Critical thinking definition

Critical thinking, as described by Oxford Languages, is the objective analysis and evaluation of an issue in order to form a judgement.
Active and skillful approach, evaluation, assessment, synthesis, and/or evaluation of information obtained from, or made by, observation, knowledge, reflection, acumen or conversation, as a guide to belief and action, requires the critical thinking process, which is why it's often used in education and academics.
Some even may view it as a backbone of modern thought.
However, it's a skill, and skills must be trained and encouraged to be used at its full potential.
People turn up to various approaches in improving their critical thinking, like:
- Developing technical and problem-solving skills
- Engaging in more active listening
- Actively questioning their assumptions and beliefs
- Seeking out more diversity of thought
- Opening up their curiosity in an intellectual way etc.
Is critical thinking useful in writing?
Critical thinking can help in planning your paper and making it more concise, but it's not obvious at first. We carefully pinpointed some the questions you should ask yourself when boosting critical thinking in writing:
- What information should be included?
- Which information resources should the author look to?
- What degree of technical knowledge should the report assume its audience has?
- What is the most effective way to show information?
- How should the report be organized?
- How should it be designed?
- What tone and level of language difficulty should the document have?
Usage of critical thinking comes down not only to the outline of your paper, it also begs the question: How can we use critical thinking solving problems in our writing's topic?
Let's say, you have a Powerpoint on how critical thinking can reduce poverty in the United States. You'll primarily have to define critical thinking for the viewers, as well as use a lot of critical thinking questions and synonyms to get them to be familiar with your methods and start the thinking process behind it.
Are there any services that can help me use more critical thinking?
We understand that it's difficult to learn how to use critical thinking more effectively in just one article, but our service is here to help.
We are a team specializing in writing essays and other assignments for college students and all other types of customers who need a helping hand in its making. We cover a great range of topics, offer perfect quality work, always deliver on time and aim to leave our customers completely satisfied with what they ordered.
The ordering process is fully online, and it goes as follows:
- Select the topic and the deadline of your essay.
- Provide us with any details, requirements, statements that should be emphasized or particular parts of the essay writing process you struggle with.
- Leave the email address, where your completed order will be sent to.
- Select your prefered payment type, sit back and relax!
With lots of experience on the market, professionally degreed essay writers , online 24/7 customer support and incredibly low prices, you won't find a service offering a better deal than ours.
Graphing Activity Lesson with Critical Thinking Questions

- Word Document File
Also included in
Description
I hope that you will follow me at: My TpT Store My Facebook Page On Pinterest On Twitter The Lesson Guide Blog Lisa Michalek ( The Lesson Guide )
Questions & Answers
Lisa michalek.
- We're hiring
- Help & FAQ
- Privacy policy
- Student privacy
- Terms of service
- Tell us what you think

Snapsolve any problem by taking a picture. Try it in the Numerade app?
IMAGES
VIDEO
COMMENTS
A set of information and beliefs, generating and processing skills, and the habit of using those skills to guide behavior. Critical thinkers: Ask questions. Gather relevant information. Think through solutions and conclusions. Consider alternative systems of thought. Communicate effectively. They're willing to admit when they're wrong or ...
Diagrams for Understanding Critical Thinking To Analyze Thinking We Must Identify and Question its Elemental Structures 8 1 7 2 3 5 4 6 to answer a question solve a problem. Whenever we think we think for a purpose based on concepts and theories to make inferences and judgements within a point of view based on assumptions leading to ...
With that goal in mind, you will find seven activities to assist you with teaching students graph design skills. A short list of the activities appears below: Activity 1 - collect charts and graphs. Activity 2 - parts of graphs and charts. Activity 3 - direct a pie chart. Activity 4 - build a bar chart.
Structure arguments. Analyse reasoning. Identify assumptions. Evaluate evidence. Rationale let's you create, online, argument maps. Argument maps are a great way to increase your critical thinking ability.
1 Introduction and background. Critical thinking has been considered a key twenty-first century competence by different frameworks (Voogt and Roblin Citation 2012) and by STEM educators (Jang Citation 2016).An education contributing to the development of twenty-first century competences requires, among other things, a reconsideration of instructional processes and a shift from teaching to know ...
It makes you a well-rounded individual, one who has looked at all of their options and possible solutions before making a choice. According to the University of the People in California, having critical thinking skills is important because they are [ 1 ]: Universal. Crucial for the economy. Essential for improving language and presentation skills.
Critical thinking is an essential element of statistics, the science of learning from data. Data visualizations, like these graphs, are an important part of statistics. They help us to understand ...
Critical thinking refers to the ability to analyze information objectively and make a reasoned judgment. It involves the evaluation of sources, such as data, facts, observable phenomena, and research findings. Good critical thinkers can draw reasonable conclusions from a set of information, and discriminate between useful and less useful ...
2.2k. Views. Can You Cultivate Critical Thinking With Infographics? contributed by Latasha Doyle. One of the most difficult aspects of teaching is ensuring that your students are actually evaluating the information, rather than just regurgitating it back to you. Critical thinking skills are incorporated into nearly every lesson plan now ...
An Elementary Guide to Critical Thinking Infographic. You've accessed 1 of your 2 free resources. Critical thinking is a highly useful skill in the workplace and in life. Discover the key fundamentals of critical thinking with this infographic.
Graphic organizers serve as a catalyst for critical thinking by providing learners with a framework to analyze, evaluate, and synthesize information. When using a graphic organizer, learners engage in higher-order thinking skills, such as analyzing the significance of information, evaluating evidence, identifying patterns, and drawing conclusions.
When looking at graphs we need to use our critical thinking skills to catch graphs where the visual cues do not lead to an accurate message. In this video I show you a graph from a media website that initially shows a more than doubling of the number of employees. But the graph axis does not start at zero so the initial interpretation is incorrect.
1 Charts and graphs. One of the most common and basic tools for visualizing your data are charts and graphs. They can display quantitative or categorical data in various formats, such as bar, line ...
Venn Diagrams. Venn diagrams are probably one of the first graphic organizers that students are introduced to. Easy to create and easy to navigate, Venn diagrams are best used for comparing and contrasting. Typically, Venn diagrams appear in the form of two to three overlapping circles, where the overlapping segments provide space for students ...
To frame this, let's look at two precursors for graph thinking. First, Seymour Papert first described computational thinking (CT) at MIT in 1980. A more fully developed version is explored in ...
Critical thinking is the use of those cognitive skills or strategies that increase the probability of a desirable outcome. It is used to describe thinking that is purposeful, reasoned, and goal directed—the kind of thinking involved in solving problems, formulating inferences, calculating likelihoods, and making decisions, when the thinker is using skills that are thoughtful and effective ...
When you look at a graph, you immediately interpret the message using the visual cues in the graph. If one column is twice as tall as another column you dedu...
The benefits of critical thinking in everyday life Building better communication. One of the most important life skills that students learn as early as elementary school is how to give a presentation. Many classes require students to give presentations, because being well-spoken is a key skill in effective communication. ... Graphs and tables ...
Share. This packet includes two worksheets that will strengthen students' skills in categorizing objects and analyzing data from a graph. Authored by: Scott Foresman, an imprint of Pearson. Grade: 2. Subjects: Graphs and Charts. Numbers and Number Sense.
The core critical-thinking skills identified in the Delphi Report as essential elements for workplace and educational success are targeted in the assessment tool entitled "The Test of Everyday Reasoning" (TER) (Facione, 2001). ... This paper presents the results from the standardization of TER in terms of graph/chart interpretation and reading ...
Critical thinking, as described by Oxford Languages, is the objective analysis and evaluation of an issue in order to form a judgement. Active and skillful approach, evaluation, assessment, synthesis, and/or evaluation of information obtained from, or made by, observation, knowledge, reflection, acumen or conversation, as a guide to belief and action, requires the critical thinking process ...
Description. Through this Graphing Practice Lesson, students will read the provided information, graph the data, analyze and then answer the critical thinking questions which follow the graphing exercise. As this lesson is self explanatory, it can be used for an in class exercise, Homework assignment, extra credit assignment or substitute ...
Yes, because the heights of the bars are representative of the percentages. A gardener measures the height in centimeters of tomato plants. Select the graph that gives a fair and accurate representation of the data. A. 5 (6 dots) 6 (3dots) 7 (zero) 8 (3dots) 9 (one dot) 10 (2dots) 11 (one dot) In particular county the average homeowner owns 0. ...
Critical Thinking Use the graph to determine if the sequence is arithmetic or geometric. If the sequence is arithmetic, state the sign of the common difference d and estimate its value. If the sequence is geometric, give the sign of the common ratio r and state if |r|<1 or |r|>1.