- 0 Shopping Cart

Japan Earthquake 2011
Japan earthquake 2011 case study.
An earthquake measuring 9.0 on the Richter Scale struck off Japan’s northeast coast, about 250 miles (400km) from Tokyo at a depth of 20 miles.
The magnitude 9.0 earthquake happened at 2:46 pm (local time) on Friday, March 11, 2011.
The earthquake occurred 250 miles off the North East Coast of Japan’s main island Honshu.

Japan 2011 Earthquake map
Japan is located on the eastern edge of the Eurasian Plate. The Eurasian plate, which is continental, is subducted by the Pacific Plate, an oceanic plate forming a subduction zone to the east of Japan. This type of plate margin is known as a destructive plate margin . The process of subduction is not smooth. Friction causes the Pacific Plate to stick. Pressure builds and is released as an earthquake.
Friction has built up over time, and when released, this caused a massive ‘megathrust’ earthquake.
The amount of energy released in this single earthquake was 600 million times the energy of the Hiroshima nuclear bomb.
Scientists drilled into the subduction zone soon after the earthquake and discovered a thin, slippery clay layer lining the fault. The researchers think this clay layer allowed the two plates to slide an incredible distance, some 164 feet (50 metres), facilitating the enormous earthquake and tsunami .

2011 Japan Earthquake Map
The earthquake occurred at a relatively shallow depth of 20 miles below the surface of the Pacific Ocean. This, combined with the high magnitude, caused a tsunami (find out more about how a tsunami is formed on the BBC website).
Areas affected by the 2011 Japanese earthquake.
What were the primary effects of the 2011 Japan earthquake?
Impacts on people
Death and injury – Some 15,894 people died, and 26,152 people were injured. 130,927 people were displaced, and 2,562 remain missing.
Damage – 332,395 buildings, 2,126 roads, 56 bridges and 26 railways were destroyed or damaged. 300 hospitals were damaged, and 11 were destroyed.
Blackouts – Over 4.4 million households were left without electricity in North-East Japan.
Transport – Japan’s transport network suffered huge disruptions.
Impacts on the environment
Landfall – some coastal areas experienced land subsidence as the earthquake dropped the beachfront in some places by more than 50 cm.
Land movement – due to tectonic shift, the quake moved parts of North East Japan 2.4 m closer to North America.
Plate shifts – It has been estimated by geologists that the Pacific plate has slipped westwards by between 20 and 40 m.
Seabed shift – The seabed near the epicentre shifted by 24 m, and the seabed off the coast of the Miyagi province has moved by 3 m.
Earth axis moves – The earthquake moved the earth’s axis between 10 and 25 cm, shortening the day by 1.8 microseconds.
Liquefaction occurred in many of the parts of Tokyo built on reclaimed land. 1,046 buildings were damaged
What were the secondary effects of the 2011 Japan earthquake?
Economy – The earthquake was the most expensive natural disaster in history, with an economic cost of US$235 billion.
Tsunami – Waves up to 40 m in high devastated entire coastal areas and resulted in the loss of thousands of lives. This caused a lot of damage and pollution up to 6 miles inland. The tsunami warnings in coastal areas were only followed by 58% who headed for higher ground. The wave hit 49% of those not following the warning.
Nuclear power – Seven reactors at the Fukushima nuclear power station experienced a meltdown. Levels of radiation were over eight times the normal levels.
Transport – Rural areas remained isolated for a long time because the tsunami destroyed major roads and local trains and buses. Sections of the Tohoku Expressway were damaged. Railway lines were damaged, and some trains were derailed.
Aftermath – The ‘Japan move forward committee’ thought that young adults and teenagers could help rebuild parts of Japan devastated by the earthquake.
Coastal changes – The tsunami was able to travel further inland due to a 250-mile stretch of coastline dropping by 0.6 m.
What were the immediate responses to the Japan 2011 earthquake?
- The Japan Meteorological Agency issued tsunami warnings three minutes after the earthquake.
- Scientists had been able to predict where the tsunami would hit after the earthquake using modelling and forecasting technology so that responses could be directed to the appropriate areas.
- Rescue workers and around 100,000 members of the Japan Self-Defence Force were dispatched to help with search and rescue operations within hours of the tsunami hitting the coast.
- Although many search and rescue teams focused on recovering bodies washing up on shore following the tsunami, some people were rescued from under the rubble with the help of sniffer dogs.
- The government declared a 20 km evacuation zone around the Fukushima nuclear power plant to reduce the threat of radiation exposure to local residents.
- Japan received international help from the US military, and search and rescue teams were sent from New Zealand, India, South Korea, China and Australia.
- Access to the affected areas was restricted because many were covered in debris and mud following the tsunami, so it was difficult to provide immediate support in some areas.
- Hundreds of thousands of people who had lost their homes were evacuated to temporary shelters in schools and other public buildings or relocated to other areas.
- Many evacuees came from the exclusion zone surrounding the Fukushima nuclear power plant. After the Fukushima Daiichi nuclear meltdown, those in the area had their radiation levels checked, and their health monitored to ensure they did not receive dangerous exposure to radiation. Many evacuated from the area around the nuclear power plant were given iodine tablets to reduce the risk of radiation poisoning.
What were the long-term responses to the Japan 2011 earthquake?
- In April 2011, one month after the event occurred, the central government established the Reconstruction Policy Council to develop a national recovery and reconstruction outlook for tsunami-resilient communities. The Japanese government has approved a budget of 23 trillion yen (approximately £190 billion) to be spent over ten years. Central to the New Growth Strategy is creating a ‘Special Zones for Reconstruction’ system. These aim to provide incentives to attract investment, both in terms of business and reconstruction, into the Tohoku region.
- Also, the central government decided on a coastal protection policy, such as seawalls and breakwaters which would be designed to ensure their performance to a potential tsunami level of up to the approximately 150-year recurrence interval.
- In December 2011, the central government enacted the ‘Act on the Development of Tsunami-resilient Communities’. According to the principle that ‘Human life is most important, this law promotes the development of tsunami-resistant communities based on the concept of multiple defences, which combines infrastructure development and other measures targeting the largest class tsunami.
- Japan’s economic growth after the Second World War was the world’s envy. However, over the last 20 years, the economy has stagnated and been in and out of recession. The 11 March earthquake wiped 5–10% off the value of Japanese stock markets, and there has been global concern over Japan’s ability to recover from the disaster. The priority for Japan’s long-term response is to rebuild the infrastructure in the affected regions and restore and improve the economy’s health as a whole.
- By the 24th of March 2011, 375 km of the Tohoku Expressway (which links the region to Tokyo) was repaired and reopened.
- The runway at Sendai Airport had been badly damaged. However, it was restored and reusable by the 29th of March due to a joint effort by the Japanese Defence Force and the US Army.
- Other important areas of reconstruction include the energy, water supply and telecommunications infrastructure. As of November 2011, 96% of the electricity supply had been restored, 98% of the water supply and 99% of the landline network.
Why do people live in high-risk areas in Japan?
There are several reasons why people live in areas of Japan at risk of tectonic hazards:
- They have lived there all their lives, are close to family and friends and have an attachment to the area.
- The northeast has fertile farmland and rich fishing waters.
- There are good services, schools and hospitals.
- 75% of Japan is mountainous and flat land is mainly found in coastal areas, which puts pressure on living space.
- They are confident about their safety due to the protective measures that have been taken, such as the construction of tsunami walls.
Japan’s worst previous earthquake was of 8.3 magnitude and killed 143,000 people in Kanto in 1923. A magnitude 7.2 quake in Kobe killed 6,400 people in 1995 .

Premium Resources
Please support internet geography.
If you've found the resources on this page useful please consider making a secure donation via PayPal to support the development of the site. The site is self-funded and your support is really appreciated.
Related Topics
Use the images below to explore related GeoTopics.
Previous Topic Page
Topic home, next topic page, share this:.
- Click to share on Twitter (Opens in new window)
- Click to share on Facebook (Opens in new window)
- Click to share on Pinterest (Opens in new window)
- Click to email a link to a friend (Opens in new window)
- Click to share on WhatsApp (Opens in new window)
- Click to print (Opens in new window)
If you've found the resources on this site useful please consider making a secure donation via PayPal to support the development of the site. The site is self-funded and your support is really appreciated.
Search Internet Geography
Top posts and pages.
Latest Blog Entries
Pin It on Pinterest
- Click to share
- Print Friendly
- International edition
- Australia edition
- Europe edition

Japan earthquake and tsunami: what happened and why
What caused the tsunami.
The most powerful earthquake recorded in Japanese history, magnitude 8.9. The tremors were the result of a violent uplift of the sea floor 80 miles off the coast of Sendai, where the Pacific tectonic plate slides beneath the plate Japan sits on. Tens of miles of crust ruptured along the trench where the tectonic plates meet. The earthquake occurred at the relatively shallow depth of 15 miles, meaning much of its energy was released at the seafloor.
How does the earthquake compare with others?
This was the sixth largest earthquake in the world since 1900, when seismological records began. The most devastating earthquake to strike Japan was in 1923, when a magnitude 7.9 tremor devastated Tokyo and Yokohama and killed an estimated 142,800 people. The Kobe earthquake in 1995 was a magnitude 6.9 and caused more than 5,000 deaths and injured 36,000 others. The earthquake that wrecked Christchurch in New Zealand last month was a magnitude 6.3 event. Around 30 times more energy is released as the magnitude of an earthquake increases one unit, for example from magnitude 8 to 9.
Why is the area so prone to earthquakes?
The Pacific plate moves fast in tectonic terms, at a rate of 9cm (3.5 inches) a year. This leads to the rapid buildup of huge amounts of energy. As the Pacific plate moves down, it sticks to the overhead plate and pulls it down too. Eventually, the join breaks, causing the seafloor to spring upwards several metres. The plate tectonics of the region are complex, and geologists are not sure which plate Japan sits on. Candidates include the Eurasian plate, the North American plate, the Okhotsk plate, and the Honshu microplate.
How big were the waves?
The largest waves measured by instruments in the water were 7 metres (nearly 23ft) high in the north-east of Japan, according to the Pacific Tsunami Warning Centre (PTWC) in Hawaii. Other estimates put the wave height at 10 metres. Waves reached 4 metres around the coast of Japan. As the tsunami spread across the Pacific, the wave height dropped to around 40cm in Guam and the nearby Marianas. The most powerful waves appeared to be moving south-west from Japan. Some countries may experience waves up to 2 metres, according to PTWC forecasts.
How much damage has been caused?
Japan has invested heavily in coastal protection and buildings that can withstand tremors. Nevertheless, ports were pounded by the tsunami and the airport in Sendai was inundated. Nuclear power plants were shut down across the country and a state of emergency declared at the Fukushima nuclear power plant, where a cooling system failed. Modern buildings in Japan are designed to absorb the violent sideways shaking that can devastate cities. High-rise buildings can still be damaged, but are more likely to remain standing. There are concerns for low-lying islands in the Pacific.
How long will the waves take to reach other countries?
The tsunami moves across the Pacific at a speed of 500mph, with waves expected to reach the island of Fiji and Cairns in Australia at 3.28pm GMT. From then, waves are due to reach Acapulco in Mexico at 7.59pm, Chile at 10.55pm, Ecuador at 11.31pm, Colombia at 11.47 and Peru at 12.33am.
Will there be aftershocks?
Regular aftershocks have already hit Japan as the Earth's crust continues to rupture along the Japan trench. Those tremors are expected to be weaker and are less likely to produce another tsunami. The release of energy along the subduction zone between the Pacific and North Atlantic plates will transfer stress to other parts of the faultline, which could easily generate more earthquakes in the region in coming months.
- Natural disasters and extreme weather
- Asia Pacific
- Earthquakes
Most viewed

An official website of the United States government
Here's how you know
The .gov means it’s official. Federal government websites often end in .gov or .mil. Before sharing sensitive information, make sure you’re on a federal government site.
The site is secure. The https:// ensures that you are connecting to the official website and that any information you provide is encrypted and transmitted securely.
On This Day: 2011 Tohoku Earthquake and Tsunami

On March 11, 2011, a magnitude (Mw) 9.1 earthquake struck off the northeast coast of Honshu on the Japan Trench. A tsunami that was generated by the earthquake arrived at the coast within 30 minutes, overtopping seawalls and disabling three nuclear reactors within days. The 2011 Tohoku Earthquake and Tsunami event, often referred to as the Great East Japan earthquake and tsunami , resulted in over 18,000 dead, including several thousand victims who were never recovered.
The deadly earthquake was the largest magnitude ever recorded in Japan and the third-largest in the world since 1900.
How It Happened
The 2011 event resulted from thrust faulting on the subduction zone plate boundary between the Pacific and North America plates, according to the U.S. Geological Survey .
This region has a high rate of seismic activity, with the potential to generate tsunamis. Past earthquakes that generated tsunamis in the region have included the deadly events of 1611 , 1896 , and 1933 .
The March 11, 2011 earthquake generated a tsunami with a maximum wave height of almost 40 meters (130 feet) in the Iwate Prefecture . Researchers also determined that a 2,000-kilometer (1,242-mile) stretch of Japan’s Pacific coast was impacted by the tsunami.
Following the earthquake, a tsunami disabled the power supply and cooling of three Fukushima Daiichi reactors, causing a significant nuclear accident . All three nuclear cores largely melted in the first three days.
As of December 2020, the Japan National Police Agency reported 15,899 deaths, 2,527 missing and presumed deaths, and 6,157 injuries for the Great East Japan event.
In Japan, the event resulted in the total destruction of more than 123,000 houses and damage to almost a million more. Ninety-eight percent of the damage was attributed to the tsunami. The costs resulting from the earthquake and tsunami in Japan alone were estimated at $220 billion USD. The damage makes the 2011 Great East Japan earthquake and tsunami the most expensive natural disaster in history.
Although the majority of the tsunami’s impact was in Japan, the event was truly global. The tsunami was observed at coastal sea level gauges in over 25 Pacific Rim countries, in Antarctica, and on the west coast of the Atlantic Ocean in Brazil.
The tsunami caused $31 million USD damage in Hawaii and $100 million USD in damages and recovery to marine facilities in California. Additionally, damage was reported in French Polynesia, Galapagos Islands, Peru, and Chile.
Fortunately, the loss of life outside of Japan was minimal (one death in Indonesia and one death in California) due to the Pacific Tsunami Warning System and its connections to national-level warning and evacuation systems.
From Peril to Preparedness
To learn from the tragedy in Japan, researchers collected extensive data on tsunami wave forces and building performance. This facilitated improvement in tsunami mitigation strategies, such as building codes. Over 6,200 tsunami wave measurements were collected in Japan and the Pacific region.
Several thousands of lives across the world were lost to large, far-afield tsunamis prior to the establishment of the Pacific Tsunami Warning System in 1965. The Great East Japan earthquake and tsunami demonstrated that despite the severity of the natural hazard the investment in the warning system has been a success.
Japan is often considered the country most prepared for tsunamis but still lost numerous lives in this event. Nonetheless, experts believe many lives were saved in Japan and elsewhere due to the existing warning and mitigation systems.
An effective tsunami warning system relies on the free and open exchange and long-term management of global data and science products to mitigate, model, and forecast tsunamis. NCEI is the global data and information service for tsunamis. Global historical tsunami data, including more information about the Great East Japan earthquake and tsunami, are available via interactive maps and a variety of web services.
For more information on how you can prepare for a tsunami, visit the National Tsunami Hazard Mitigation Program . Also, visit NCEI’s Natural Hazards website for more earthquake and tsunami data, images, and educational materials.
Kong, L., P. Dunbar, and N. Arcos (2015). Pacific Tsunami Warning System: A Half-Century of Protecting the Pacific 1965-2015. Honolulu: International Tsunami Information Center.
Satake, K. (2014). Chapter 24, The 2011 Tohoku, Japan, Earthquake and Tsunami. Extreme Natural Hazards, Disaster Risks and Societal Implications, Cambridge University Press, p. 340-351.
UNESCO/IOC (2012). Summary Statement from the Japan - UNESCO - UNU Symposium on The Great East Japan Tsunami on 11 March 2011 and Tsunami Warning Systems: Policy Perspectives 16 - 17 February 2012
Broken links updated.
Related Links
Article tags, related news.

August 25, 2023
On This Day: 2009 Samoa Islands Tsunami

August 16, 2023
On This Day: Historic Krakatau Eruption of 1883

March 3, 2023

Case Study: How does Japan live with earthquakes?
Japan lies within one of the most tectonically active zones in the world. It experiences over 400 earthquakes every day. The majority of these are not felt by humans and are only detected by instruments. Japan has been hit by a number of high-intensity earthquakes in the past. Since 2000 there are have been 16000 fatalities as the result of tectonic activity.
Japan is located on the Pacific Ring of Fire, where the North American, Pacific, Eurasian and Philippine plates come together. Northern Japan is on top of the western tip of the North American plate. Southern Japan sits mostly above the Eurasian plate. This leads to the formation of volcanoes such as Mount Unzen and Mount Fuji. Movements along these plate boundaries also present the risk of tsunamis to the island nation. The Pacific Coastal zone, on the east coast of Japan, is particularly vulnerable as it is very densely populated.
The 2011 Japan Earthquake: Tōhoku
Japan experienced one of its largest seismic events on March 11 2011. A magnitude 9.0 earthquake occurred 70km off the coast of the northern island of Honshu where the Pacific and North American plate meet. It is the largest recorded earthquake to hit Japan and is in the top five in the world since records began in 1900. The earthquake lasted for six minutes.

A map to show the location of the 2011 Japan Earthquake
The earthquake had a significant impact on the area. The force of the megathrust earthquake caused the island of Honshu to move east 2.4m. Parts of the Japanese coastline dr[[ed by 60cm. The seabed close to the focus of the earthquake rose by 7m and moved westwards between 40-50m. In addition to this, the earthquake shifted the Earth 10-15cm on its axis.
The earthquake triggered a tsunami which reached heights of 40m when it reached the coast. The tsunami wave reached 10km inland in some places.
What were the social impacts of the Japanese earthquake in 2011?
The tsunami in 2011 claimed the lives of 15,853 people and injured 6023. The majority of the victims were over the age of 60 (66%). 90% of the deaths was caused by drowning. The remaining 10% died as the result of being crushed in buildings or being burnt. 3282 people were reported missing, presumed dead.
Disposing of dead bodies proved to be very challenging because of the destruction to crematoriums, morgues and the power infrastructure. As the result of this many bodies were buried in mass graves to reduce the risk of disease spreading.
Many people were displaced as the result of the tsunami. According to Save the Children 100,000 children were separated from their families. The main reason for this was that children were at school when the earthquake struck. In one elementary school, 74 of 108 students and 10 out of 13 staff lost their lives.
More than 333000 people had to live in temporary accommodation. National Police Agency of Japan figures shows almost 300,000 buildings were destroyed and a further one million damaged, either by the quake, tsunami or resulting fires. Almost 4,000 roads, 78 bridges and 29 railways were also affected. Reconstruction is still taking place today. Some communities have had to be relocated from their original settlements.
What were the economic impacts of the Japanese earthquake in 2011?
The estimated cost of the earthquake, including reconstruction, is £181 billion. Japanese authorities estimate 25 million tonnes of debris were generated in the three worst-affected prefectures (counties). This is significantly more than the amount of debris created during the 2010 Haiti earthquake. 47,700 buildings were destroyed and 143,300 were damaged. 230,000 vehicles were destroyed or damaged. Four ports were destroyed and a further 11 were affected in the northeast of Japan.
There was a significant impact on power supplies in Japan. 4.4 million households and businesses lost electricity. 11 nuclear reactors were shut down when the earthquake occurred. The Fukushima Daiichi nuclear power plant was decommissioned because all six of its reactors were severely damaged. Seawater disabled the plant’s cooling systems which caused the reactor cores to meltdown, leading to the release of radioactivity. Radioactive material continues to be released by the plant and vegetation and soil within the 30km evacuation zone is contaminated. Power cuts continued for several weeks after the earthquake and tsunami. Often, these lasted between 3-4 hours at a time. The earthquake also had a negative impact on the oil industry as two refineries were set on fire during the earthquake.
Transport was also negatively affected by the earthquake. Twenty-three train stations were swept away and others experienced damage. Many road bridges were damaged or destroyed.
Agriculture was affected as salt water contaminated soil and made it impossible to grow crops.
The stock market crashed and had a negative impact on companies such as Sony and Toyota as the cost of the earthquake was realised. Production was reduced due to power cuts and assembly of goods, such as cars overseas, were affected by the disruption in the supply of parts from Japan.
What were the political impacts of the Japanese earthquake in 2011?
Government debt was increased when it injects billions of yen into the economy. This was at a time when the government were attempting to reduce the national debt.
Several years before the disaster warnings had been made about the poor defences that existed at nuclear power plants in the event of a tsunami. A number of executives at the Fukushima power plant resigned in the aftermath of the disaster. A movement against nuclear power, which Japan heavily relies on, developed following the tsunami.
The disaster at Fukushima added political weight in European countries were anti-nuclear bodies used the event to reinforce their arguments against nuclear power.
Privacy Overview
Pin it on pinterest.
You must be logged in to post a comment.
Premium Content

Japan's 2011 megaquake left a scar at the bottom of the sea. Scientists finally explored it.
A towering cliff in the Japan Trench of the Pacific Ocean “is unlike anything that’s been observed by science before.”
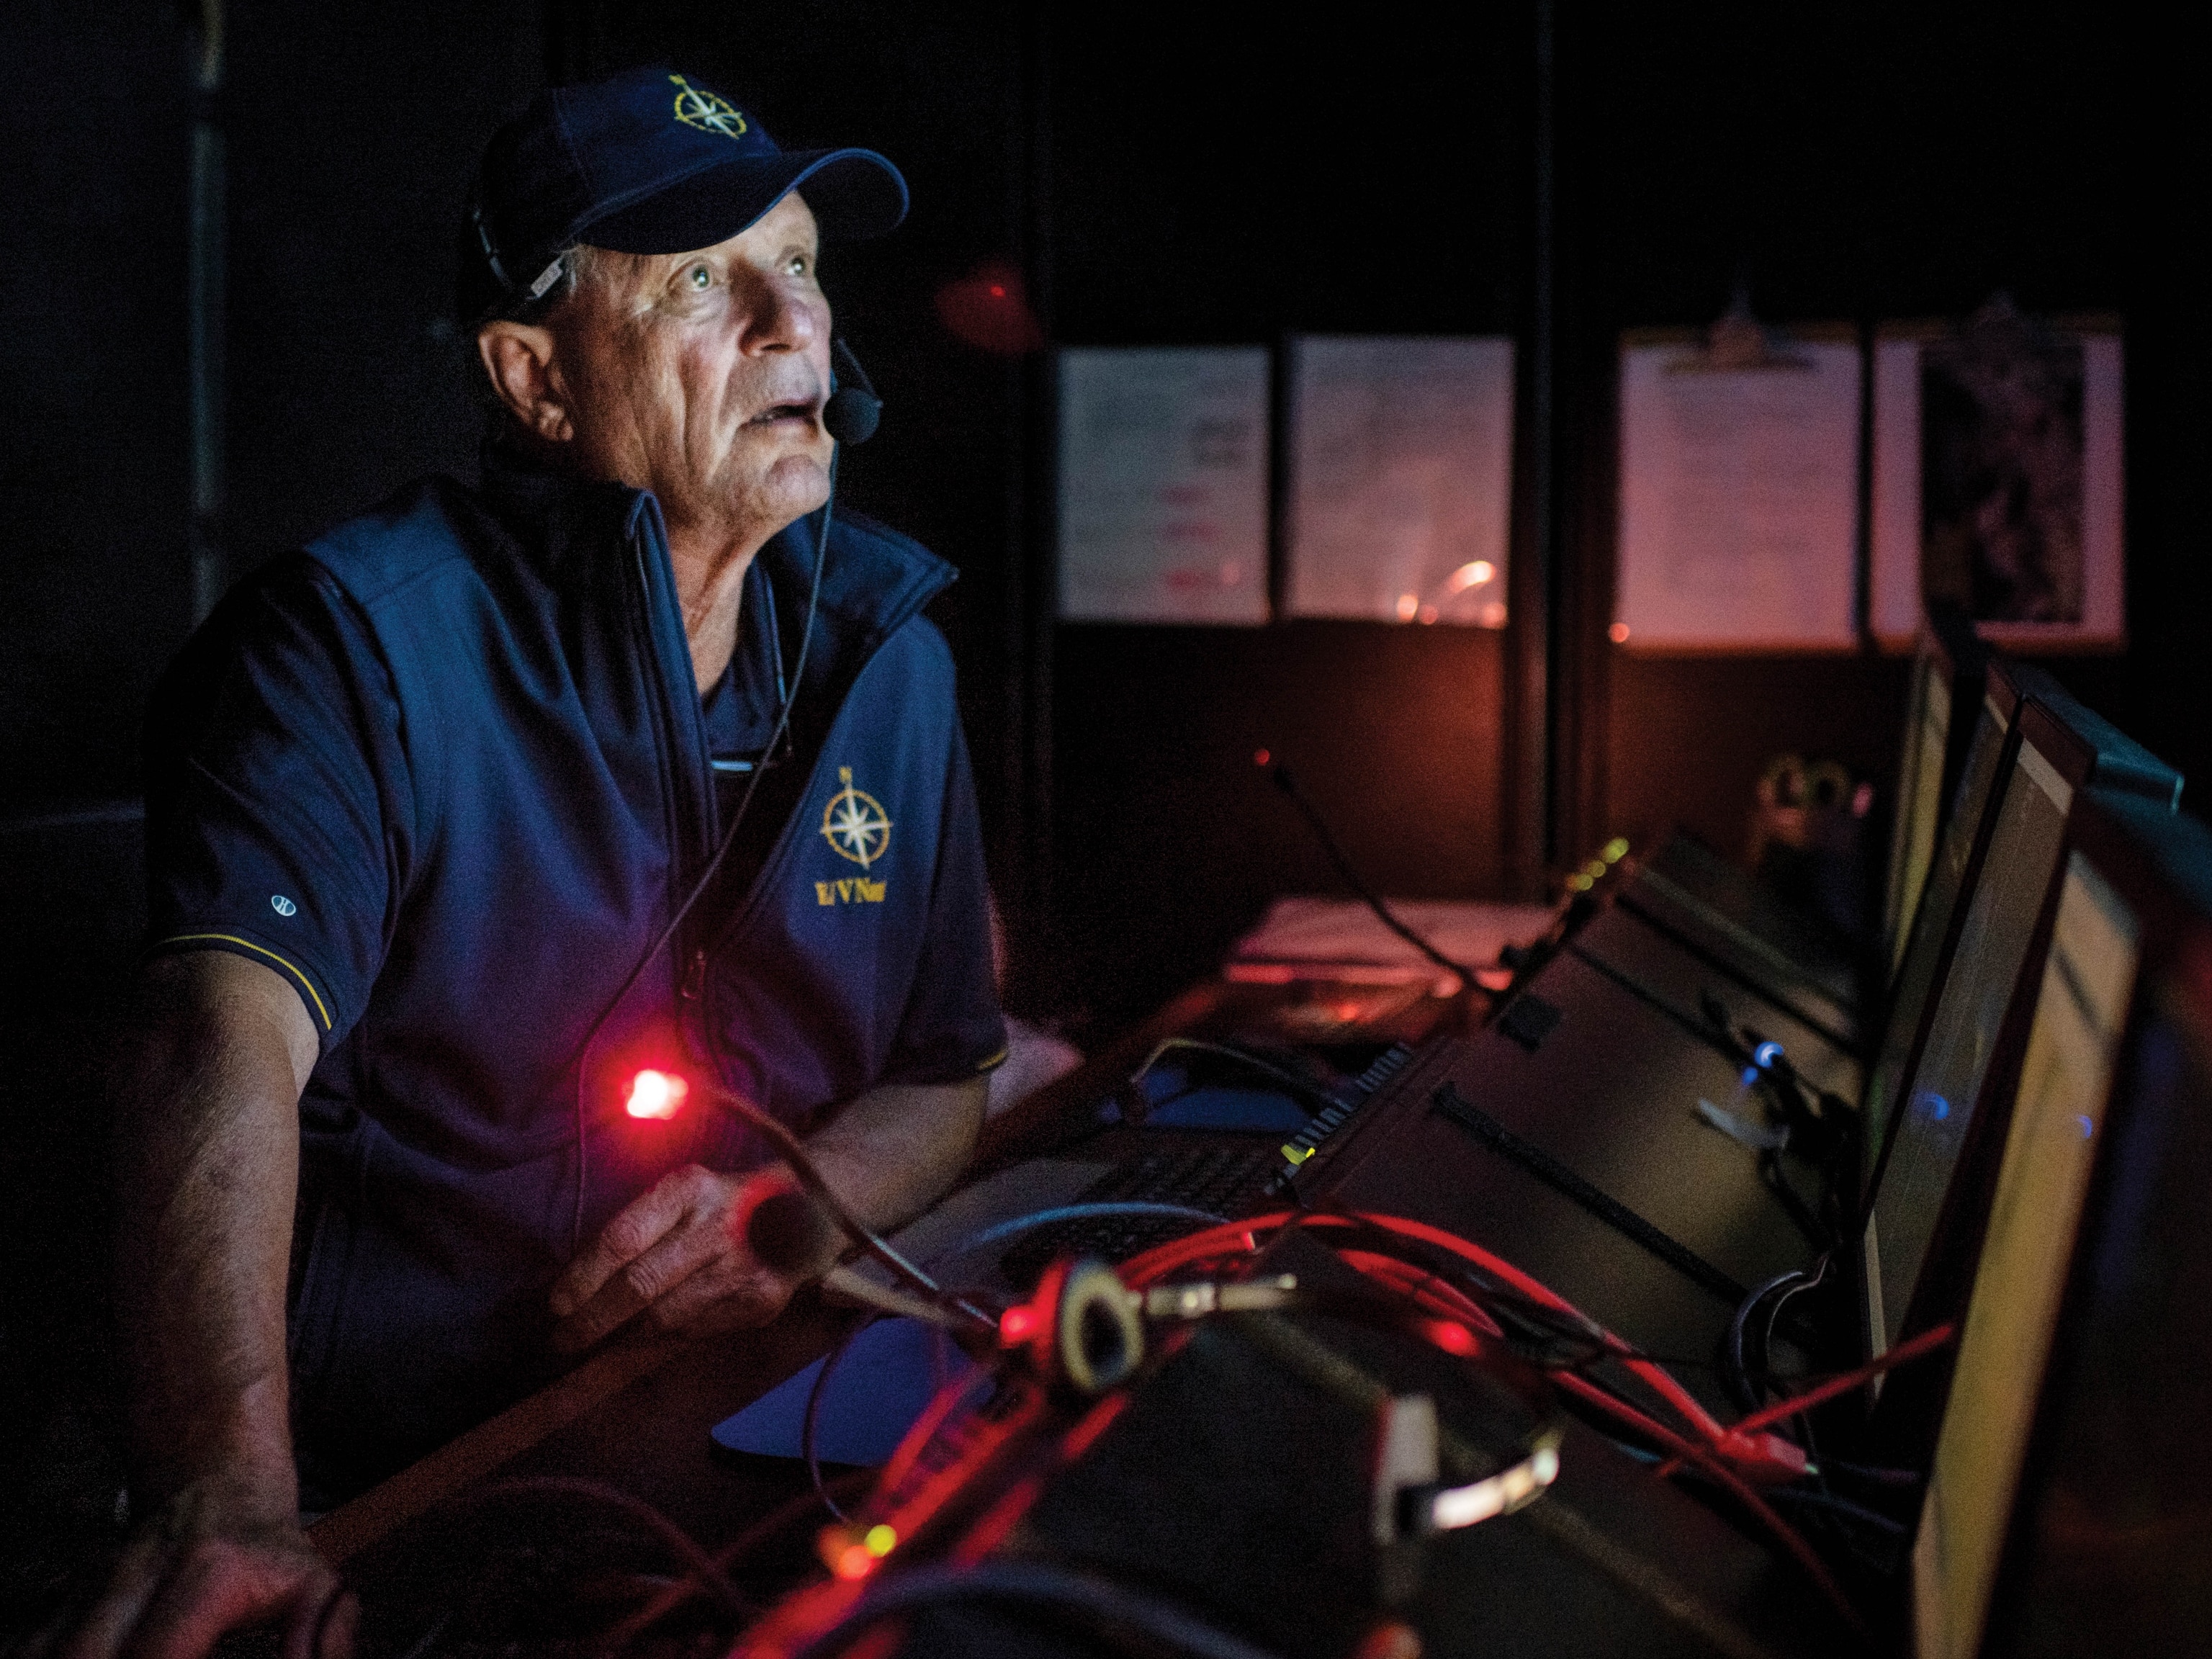
They were enveloped in an oppressive darkness. The sun, miles above, had vanished long ago. Through tiny windows, they could see the seafloor’s sediments glimmering in the submersible’s headlights. Curious fish flitted around their vessel.
Carefully navigating the inky-black waters was a little like “driving in a car at midnight along a mountain road,” says Hayato Ueda , a geoscientist at Niigata University in Japan and one of the sub’s two occupants.
Ueda and pilot Chris May searched the darkness in their claustrophobic vessel, and eventually a lofty geologic monument emerged from the shadows: an 85-foot-tall cliff climbing into the ocean above. The exposed crest of a cataclysmic rift in Earth’s crust, exactly where Ueda predicted it would be, was part of one of the worst disasters in modern history.
This cliff is a scar of the 2011 Tōhoku earthquake that struck off Japan’s eastern shores. That year, on March 11, the magnitude 9.1 temblor deep within the Pacific Ocean unleashed a catastrophic tsunami that hit Japan, killing around 20,000 people and leaving half a million homeless.
In the past decade, scientists have studied the quake by decoding its seismic waves and scanning the depths with sonar. But getting a detailed understanding of what caused the seafloor to convulse required something that initially seemed impossible: examining part of the rupture site in person, within the Japan Trench, almost five miles below the waves.
In 2022 scientists made that ambitious mission a reality. They secured a privately owned deep-sea vessel, the DSV Limiting Factor —a submersible cleared to safely take people down to the crushing, benighted seafloor.
Plunging into the Japan Trench, the divers eventually came upon the incongruous cliff. As reported in a study the journal Communications Earth and Environment , the team determined that this cliff represented the top of a section of a chunk of crust that jumped up by over 190 feet during the 2011 earthquake.

This appears to be “the very absolute tip of the fault that generated that massive earthquake,” says Harold Tobin , director of the Pacific Northwest Seismic Network at the University of Washington, who wasn’t involved in the study. “In this one place, the tip came all the way to the surface and pushed everything up. And they tagged it, they identified it directly in the field. And that’s incredible.”
Uplift features like this have been observed on land, but this is the first time one has been glimpsed by humans in a deep-sea subduction zone trench. This “is unlike anything that’s been observed by science before,” says Christie Rowe , an earthquake geologist at McGill University who was also not involved with the study.
Decoding a disaster
The entire rupture happened over a vast section of the abyss. To have created so much uplift, the fault responsible must have moved about 330 feet near the epicenter during the quake—the largest fault movement of its kind on record. The violently uprooted cliff that resulted was part of the reason the quake generated a calamitous tsunami.
The location of this megaquake is not so surprising. The Japan Trench is a major quake-making machine ; since 1973, it has produced nine temblors above magnitude 7. This frequent shaking occurs because the trench is a subduction zone, where the colossal Pacific tectonic plate is being forced underneath the Okhotsk microplate.
But even so, the 2011 quake proved surprisingly powerful. It struck a little westward of the Japan Trench, about 18 miles below the seafloor, causing a gargantuan rupture over a 24,000-square-mile area. Seismic waves from the event and sonar-like mapping conducted by ships before and immediately after the quake suggested the fault responsible moved as much as 200 feet—an almost unbelievable amount, and still less than the recent expedition has ascertained.
“The Tohoku earthquake was obviously a massive watershed event. It’s a game changer in lots of ways,” says Tobin. Unraveling that fault’s behavior matters not just to Japan, but to anywhere in the world that will one day experience its own subduction-zone triggered tsunami, including the U.S. Pacific Northwest , which was inundated by a major tsunami three centuries ago.
The geologic jolt in Japan seemed so extreme that scientists wanted to find the physical evidence of it at the site itself. “It’s like what a geologist would do in the field,” says Tobin. “Except this happens to be eight kilometers [five miles] below the surface of the water.” At those high-pressure depths, most submersibles—including robotic ones—would malfunction or implode .
Enter: DSV Limiting Factor . Built by the American manufacturer Triton Submarines , and funded and owned by Victor Vescovo —an investor, former naval officer, and undersea explorer—this highly durable two-person vessel can dive down to 36,000 feet, making it one of the only submersibles capable of the journey into the Japan Trench.
“It’s an incredible submarine,” says Tobin.
You May Also Like

The story of Turtle, one of the world's first submersibles
Haunted Appalachia? These ancient mountains witnessed the birth of man and monster
The lost continent of Zealandia has been mapped for the first time
Illuminating the abyss.
In September 2022, drifting on the Pacific’s midnight-blue waves aboard the support boat DSSV Pressure Drop , Ueda and his colleagues perused their geologic and bathymetric charts. “I had to decide the exact point where the submersible will land,” he says. “I carefully read topography from the map and selected the most probable point where the fault features could exist.”
A proverbial X was scored on the map. They were ready. On September 4, Ueda and pilot Chris May climbed into the two cramped seats of the DSV Limiting Factor and began their quest into the depths.
After several hours they reached the seafloor within the Japan Trench. Ueda had visited oceanic depths before, but nothing this deep and dark. Throughout their dive, video cameras mounted on the outside of the submersible recorded their traversal, including the approach to the 85-foot-high cliff that did not exist prior to the 2011 quake.
“On the way floating up to the sea surface, I had much time—I don't remember well, but perhaps two hours or more—to consider about what I saw,” says Ueda. When he rewatched the video recordings from the dive, he became confident: this was something known as fault scarp, a part of the earthquake’s surface breakthrough that causes a change in elevation.
But the cliff was only the very top of the uplift. To properly measure its scale, the submersible had risen to the feature’s peak—and as it ascended, its pressure sensors were used to calculate the height difference between the basin floor at the clifftop. It was 194 feet—the seafloor’s vertical displacement at this location during the 2011 megaquake, according to the study.
The seafloor likely rose along many parts of the gigantic rupture in the Pacific, but this section jumped up by the height of a 14-story building. “That displacement is at least part of the tsunami source,” says Tobin.
Quakes of the deep
Using this new information, the team estimates that the fault slipped by 260 to 400 feet in total at this location during the earthquake—a staggering amount, perhaps twice as much as previously suspected.
It’s a reasonable calculation, says Judith Hubbard , an earthquake scientist at Cornell University not involved with the study. But reconstructing fault geometry on land is troublesome. Doing the same work on the seafloor—doubly so. And in tectonic terms, this part of the crust is a tangled nightmare. “This is a really complicated area. There’s a huge amount of stuff going on,” Hubbard says.
Crucially, though, “they didn’t overdo their claims,” says Tobin, who considers the evidence direct, robust, and elegant. Scientists knew the 2011’s rupture’s slip was tremendous. “This case is as bulletproof as you’re ever going to get,” he says.
The 2011 quake still retains much of its mystery. This site represents just a small section of an expansive rupture, and each part behaved uniquely during the fault’s mighty jolt. “It is difficult to provide an idea or story about the entire disaster,” says Ueda.
But this study has already set a new benchmark for untangling the depths and enigmas of subduction zone megaquakes. “I didn’t know it was technically possible” to make this journey to the seafloor, says Rowe. “I’m super pumped. It’s like being an astronaut.”
This work will bring protective benefits to Japan’s shores, and it will no doubt provide scientific succor to other coastal nations. Over the past two decades, an increasing number of tsunami early-warning systems have been placed in the world’s oceans. They rely on catching the seismic waves from aquatic quakes and quickly analyzing them.
But scientists are sometimes surprised. A tsunami can be forecast, but it can be more significant than predicted, or considerably smaller—or even nonexistent. The most important question is: “How big is that scarp on the seafloor? Because that’s your tsunami trigger,” says Rowe.
Using this study and other research to tweak tsunami forecast models could bolster efforts to save lives in future geologic disasters.
“It was surely fantastic to see such important features that nobody has ever seen. I'm honored to find it,” says Ueda. But he recounts his discovery with a somber note. “It might be this cliff that took more than 20,000 lives.”
Related Topics
- EARTHQUAKES
- SUBMERSIBLES
The surprising source of Turkey's volcanoes lies more than 1,000 miles away
Iceland's latest eruption is quieting down—but the explosive upheaval isn't over yet
Bob Ballard and James Cameron on what we can learn from Titan
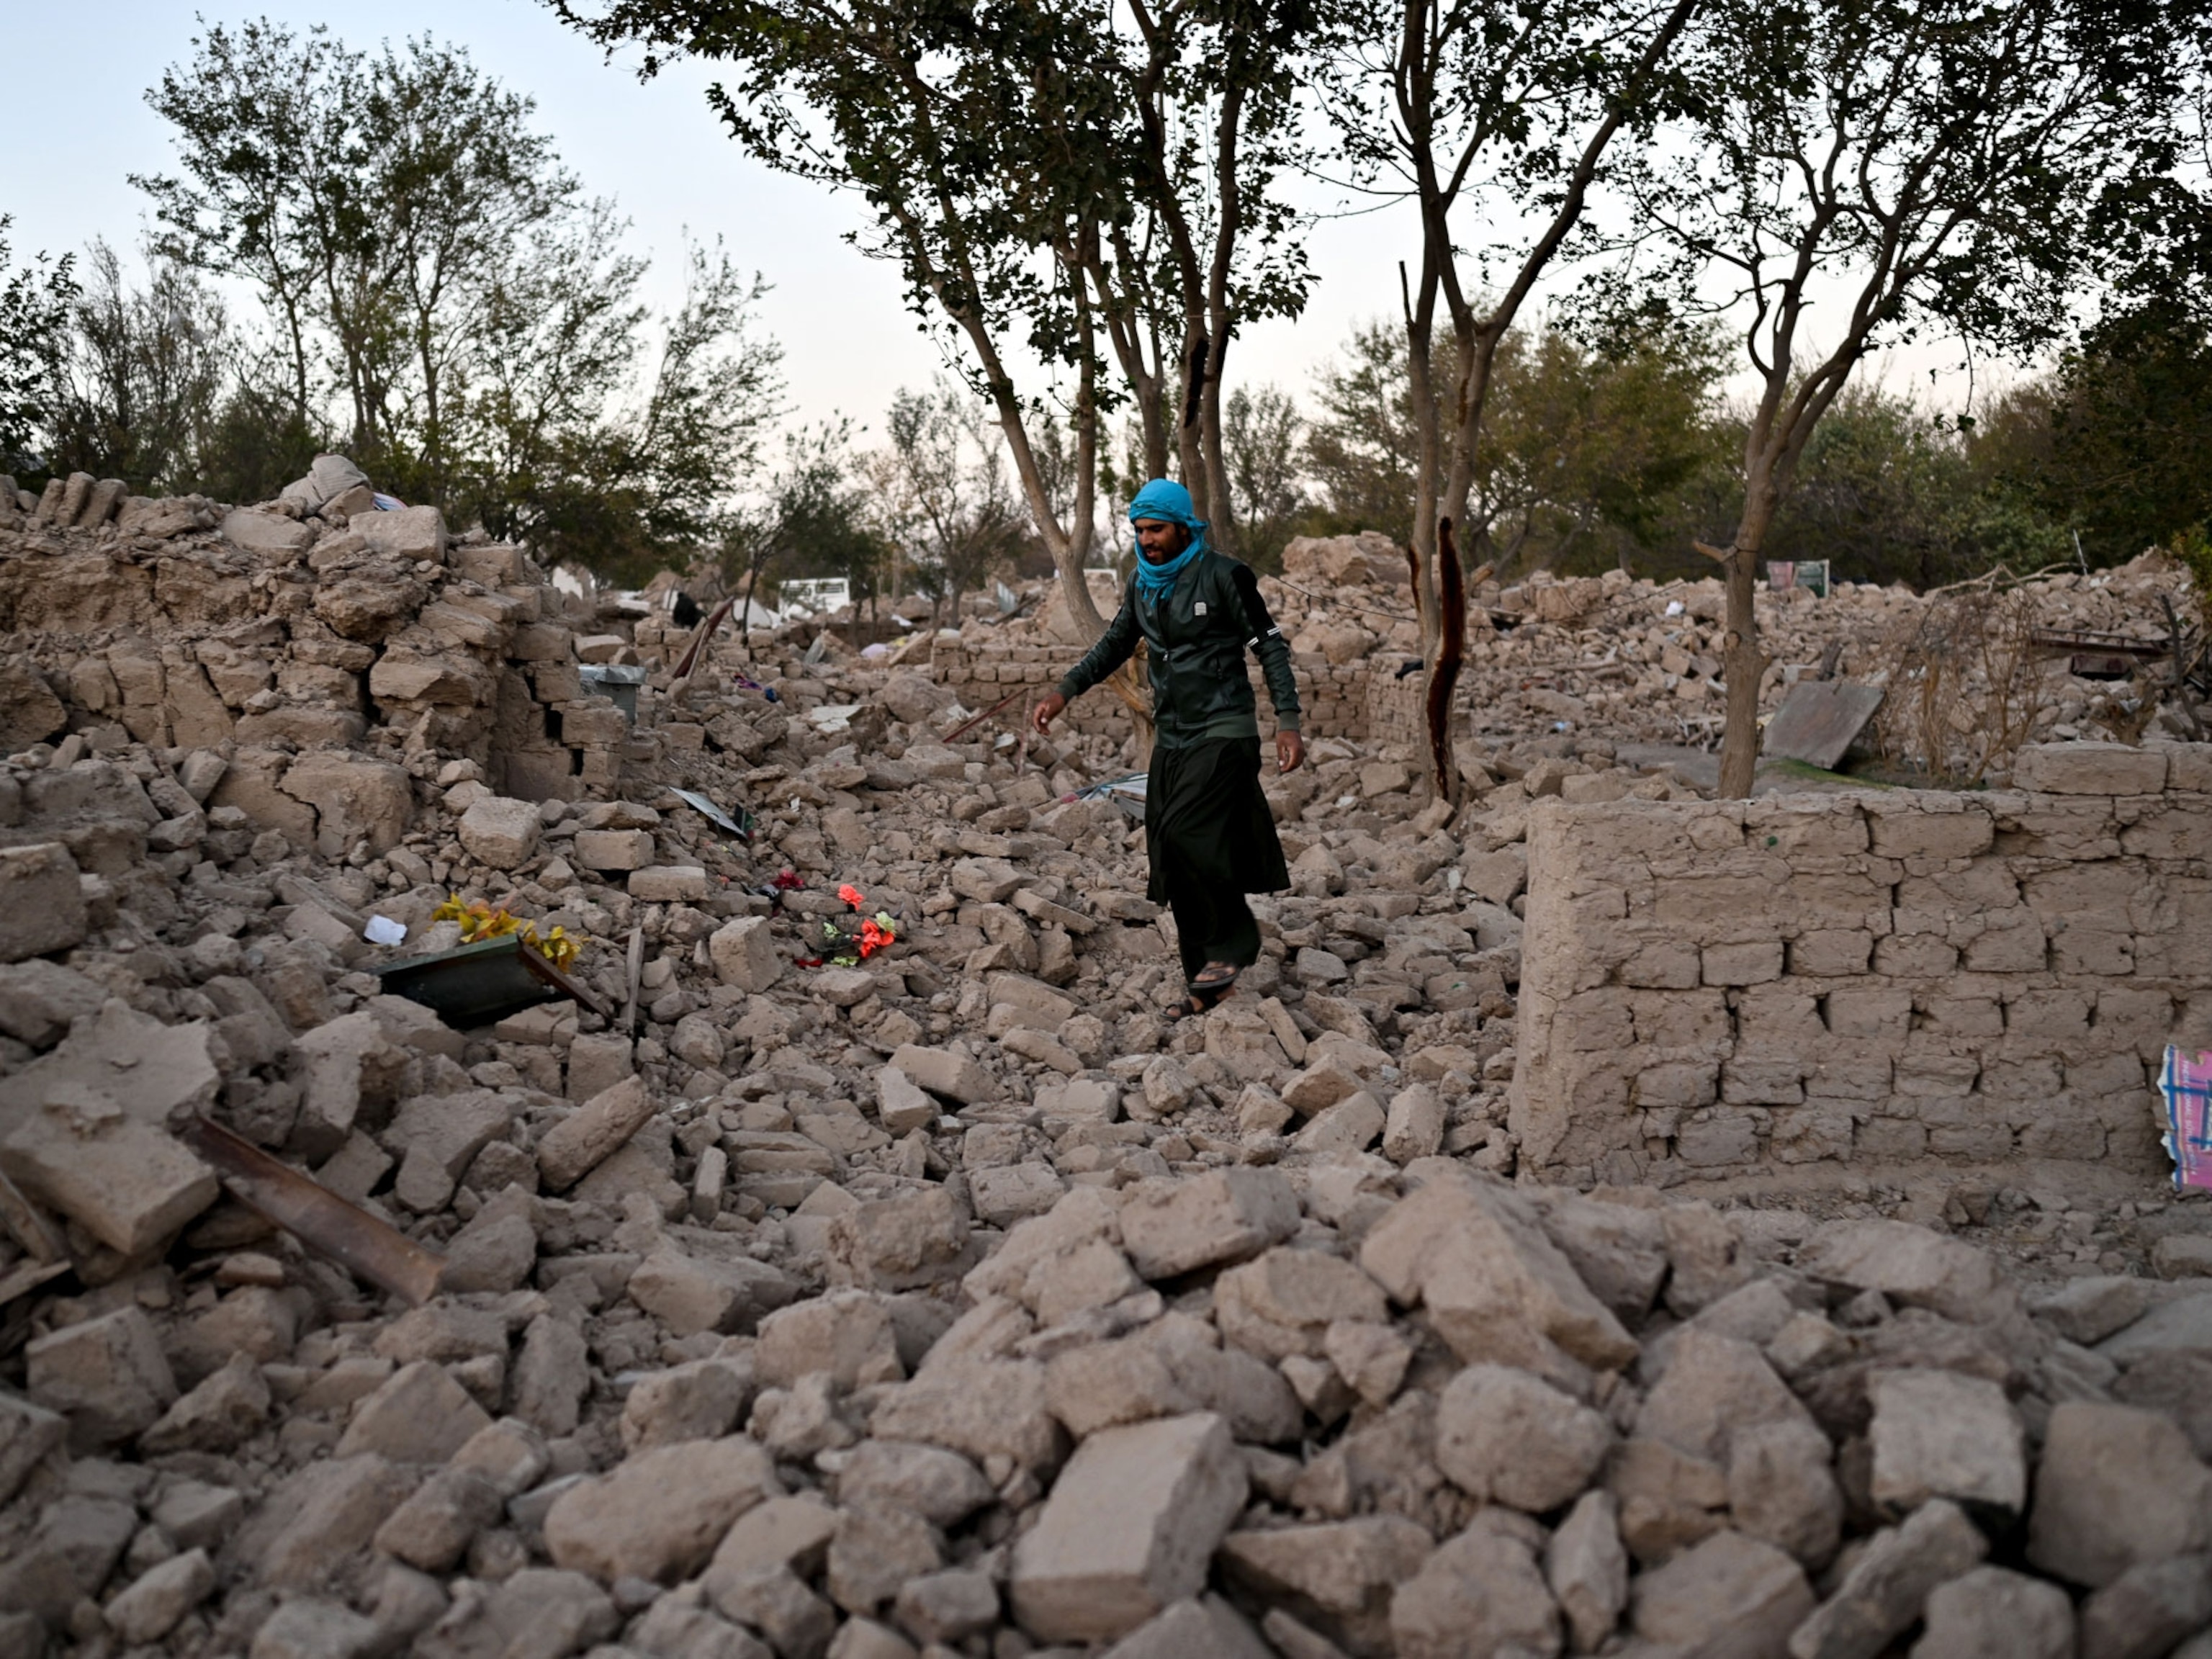
A rare and puzzling ‘domino effect’ triggered 4 powerful quakes in Afghanistan
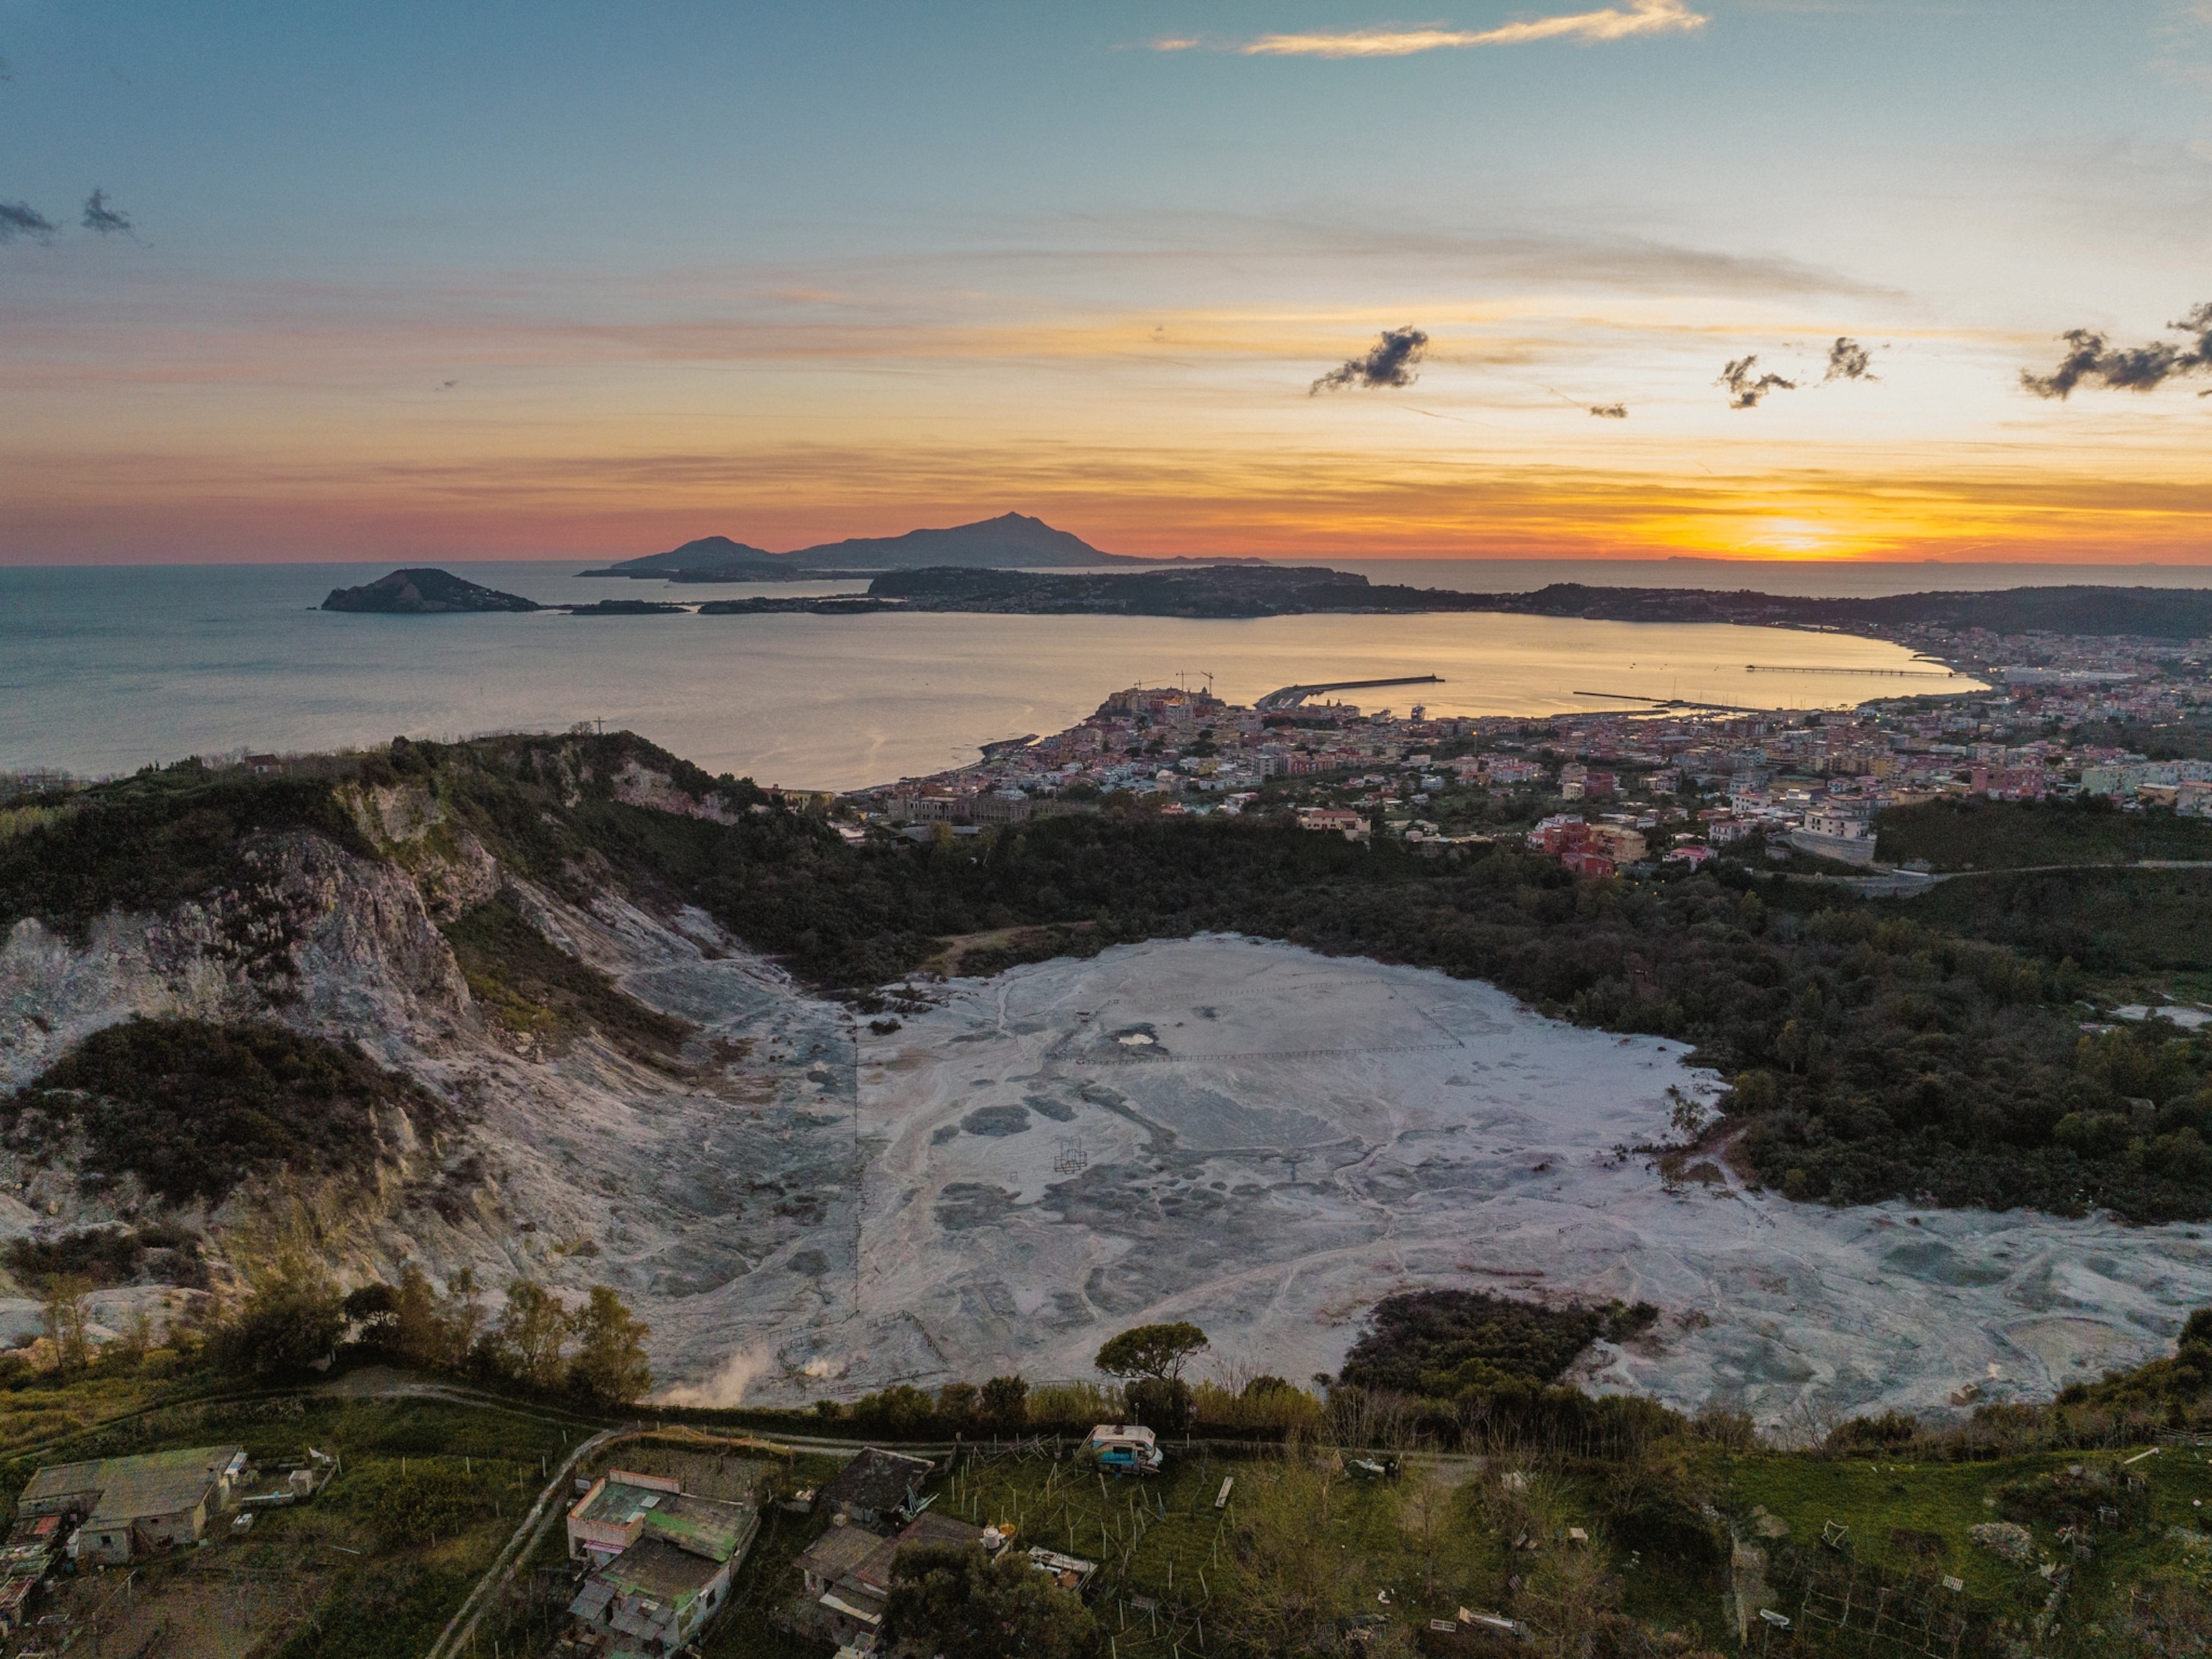
A huge volcano near Naples has been convulsing. What does it mean?
- Perpetual Planet
- Environment
- History & Culture
- Paid Content
History & Culture
- Photography
- Terms of Use
- Privacy Policy
- Your US State Privacy Rights
- Children's Online Privacy Policy
- Interest-Based Ads
- About Nielsen Measurement
- Do Not Sell or Share My Personal Information
- Nat Geo Home
- Attend a Live Event
- Book a Trip
- Inspire Your Kids
- Shop Nat Geo
- Visit the D.C. Museum
- Learn About Our Impact
- Support Our Mission
- Advertise With Us
- Customer Service
- Renew Subscription
- Manage Your Subscription
- Work at Nat Geo
- Sign Up for Our Newsletters
- Contribute to Protect the Planet
Copyright © 1996-2015 National Geographic Society Copyright © 2015-2024 National Geographic Partners, LLC. All rights reserved
10 years after the 2011 Tohoku earthquake: A milestone of solid earth science
Progress in Earth and Planetary Science welcomes submissions to the special issue on '10 years after the 2011 Tohoku earthquake: A milestone of solid earth science'.
A number of new discoveries have been made in the aftermath of the 2011 Tohoku earthquake, thanks to unprecedented near-field observations as well as to the earth scientific knowledge about the northeastern Japan arc that has accumulated prior to the earthquake. The earthquake highlighted the complexity of frictional behaviors on the shallowest part of the subduction interface, previously regarded as mostly aseismic. Several pieces of evidence have been presented that illuminate the spatial correlation between the distribution of interplate faulting events of various sizes and time scales and associated structural heterogeneities. The stress re-distribution processes after the earthquake, including viscoelastic deformation and fluid remobilization, have been revealed both in the overriding and incoming plates and provide new insights in the dynamics of the subduction zone. Abundant records of the associated tsunami clarified various processes during the generation, propagation, and inundation of tsunamis. The earthquake also provides a unique opportunity to compare the fault model constrained by modern observations with those of past earthquakes based on geological records so that we can improve the reconstructed recurrence history of massive earthquakes. It is expected that a collection of research contributions regarding the Tohoku earthquake will benefit our general understanding regarding infrequent great (M > 9) subduction earthquakes.
In this special issue of SPEPS, we invite authors to contribute their latest research or reviews on the seismotectonics along the northeastern Japan margin from disciplinary and interdisciplinary viewpoints. The scope of this issue ranges across, but is not limited to, the diversity of fault behaviors along the plate boundary and its relation to structural heterogeneity of the plate boundary zone, postseismic deformation and seismicity, behavior of tsunamis, and earthquake geology and paleoseismology along the Japan trench.
Deadline for submissions
Submission start: 1 October 2021
Submission deadline: 31 August 2022
Guest Editors
Takeshi Iinuma JAMSTEC email: [email protected]
Shuichi Kodaira JAMSTEC email: [email protected]
Masaki Yamada Shinshu University email: [email protected]
Roland Bürgmann University of California, Berkeley email: [email protected]
Toru Matsuzawa Tohoku University, Japan email: [email protected]
Ryota Hino Tohoku University, Japan email: [email protected]
The nature of the Pacific plate as subduction inputs to the northeastern Japan arc and its implication for subduction zone processes
Devastating megathrust earthquakes and slow earthquakes both occur along subducting plate interfaces. These interplate seismic activities are strongly dependent on the nature of the plate interface, such as th...
- View Full Text

Marine inundation history during the last 3000 years at Lake Kogare-ike, a coastal lake on the Pacific coast of central Japan
Sediment cores collected at Lake Kogare-ike, a coastal lake on the Pacific coast of central Japan, record the marine inundation history during the last 3000 years. The sediments consist mainly of organic mud, ...

Incoming plate structure at the Japan Trench subduction zone revealed in densely spaced reflection seismic profiles
The structure of the incoming plate is an important element that is often considered to be related to the occurrence of great earthquakes in subduction zones. In the Japan Trench, where the 2011 Tohoku earthqu...

Progress in modeling the Tohoku-oki megathrust earthquake cycle and associated crustal deformation processes
This paper summarizes the results of 10 years of research on models of the megathrust earthquake cycles and crustal deformation associated with the 2011 Tohoku-oki earthquake. Several earthquake cycle models h...

Recurrence intervals for M > 7 Miyagi-ken-Oki earthquakes during an M ~ 9 earthquake cycle
The 2011 Tohoku-Oki great earthquake increased the difficulty of evaluating the long-term probability of seismic activity along the Japan Trench because of the unknown impact of the unprecedentedly large slip....

Progress and application of the synthesis of trans-oceanic tsunamis
Abundant high-quality distant tsunami records from the 2010 Maule (Chile) and 2011 Tohoku-Oki earthquakes have revealed two distinctive features compared to long-wave tsunami simulations. The records show that...

Abrupt water temperature increases near seafloor during the 2011 Tohoku earthquake
We investigated temperature records associated with seafloor pressure observations at eight stations that experienced the 2011 M w 9 Tohoku earthquake near its epicenter. The temperature data were based on the tem...

Sedimentary diversity of the 2011 Tohoku-oki tsunami deposits on the Sendai coastal plain and the northern coast of Fukushima Prefecture, Japan
This paper documents the sedimentary characteristics of the widespread deposits associated with the 2011 Tohoku-oki tsunami on the lowlands along the Pacific coast of the Sendai and Fukushima regions, northern...

Submarine paleoseismology in the Japan Trench of northeastern Japan: turbidite stratigraphy and sedimentology using paleomagnetic and rock magnetic analyses
Previous studies of sediments recovered from the Japan Trench between 37° 25′ N and 38° 30′ N document distinctive turbidite beds induced by huge earthquakes. We studied two sediment cores at 39°N to investiga...
The Correction to this article has been published in Progress in Earth and Planetary Science 2023 10 :22

Fault geometry of M6-class normal-faulting earthquakes in the outer trench slope of Japan Trench from ocean bottom seismograph observations
Since the 2011 Mw 9.0 Tohoku-oki earthquake, intra-plate normal-faulting earthquakes, including several M7-class earthquakes, have occurred in the outer trench slope area from the trench to the outer rise alon...

Heterogeneous rheology of Japan subduction zone revealed by postseismic deformation of the 2011 Tohoku-oki earthquake
The 2011 Tohoku-oki earthquake produced the most well-recorded postseismic deformation of any megathrust earthquake in the world. Over the last decade, researchers have used a dense and widespread geodetic n...

How large peak ground acceleration by large earthquakes could generate turbidity currents along the slope of northern Japan Trench
Deep-sea turbidite has been used to determine the history of occurrence of large earthquakes. Surface-sediment remobilization is a mechanism of the generation of earthquake-induced turbidity currents. However,...
The Correction to this article has been published in Progress in Earth and Planetary Science 2023 10 :15

A review on slow earthquakes in the Japan Trench
Slow earthquakes are episodic slow fault slips. They form a fundamental component of interplate deformation processes, along with fast, regular earthquakes. Recent seismological and geodetic observations have ...

Assessment of S-net seafloor pressure data quality in view of seafloor geodesy
Long-term continuous observation of seafloor pressure is effective for detecting seafloor vertical deformations that are associated with transient tectonic phenomena such as slow slip events. Since the aseismi...

Numerical estimation of a tsunami source at the flexural area of Kuril and Japan Trenches in the fifteenth to seventeenth century based on paleotsunami deposit distributions in northern Japan
Paleotsunami deposit investigations and numerical tsunami computations have been performed to elucidate the source and size of large tsunamis along the Kuril to Japan Trenches, particularly for unusual tsunami...

Washover deposits related to tsunami and storm surge along the north coast of the Shimokita Peninsula in northern Japan
A decade after the 2011 Tohoku-oki earthquake (Mw 9.0), geological surveys were conducted at multiple sites along the Pacific Coast of the tsunami-inundated Tohoku region in Japan, providing thousands of years...

Tectonic tremors immediately after the 2011 Tohoku-Oki earthquake detected by near-trench seafloor seismic observations
Temporal seismic observations from pop-up type ocean-bottom seismometers were used to detect tectonic tremors immediately following the 2011 Tohoku-Oki earthquake in the northern periphery of the aftershock ar...

A new mechanical perspective on a shallow megathrust near-trench slip from the high-resolution fault model of the 2011 Tohoku-Oki earthquake
The 2011 Tohoku-Oki earthquake generated a surprisingly large near-trench slip, and earth scientists have devoted significant attention to understanding why. Some studies proposed special rupture mechanisms, s...

To what extent tsunami source information can be extracted from tsunami deposits? Implications from the 2011 Tohoku-oki tsunami deposits and sediment transport simulations
A quantitative understanding of paleotsunamis is a significant issue in tsunami sedimentology. Onshore tsunami deposits, which are geological records of tsunami inundation, are used to reconstruct paleotsunami...

Continuous estimation of coseismic and early postseismic slip phenomena via the GNSS carrier phase to fault slip approach: a case study of the 2011 Tohoku-Oki sequence
The transition process from coseismic to early postseismic phenomena within a half-day remains a significant topic for understanding the slip budget and friction properties of the fault. However, the investiga...

Short-wave run-ups of the 1611 Keicho tsunami along the Sanriku Coast
A tsunami generated by an earthquake that occurred off the east coast of Japan in 1611 was predominantly concentrated along the Sanriku Coast. The 1611 event produced its greatest observed tsunami height at Ko...

Identifying tsunami traces beyond sandy tsunami deposits using terrigenous biomarkers: a case study of the 2011 Tohoku-oki tsunami in a coastal pine forest, northern Japan
The distributions of sandy tsunami deposits do not reflect the true extents of tsunami inundation areas, leading to underestimates of inundation by past tsunamis and thus the magnitudes of their associated tsu...

Thank you for visiting nature.com. You are using a browser version with limited support for CSS. To obtain the best experience, we recommend you use a more up to date browser (or turn off compatibility mode in Internet Explorer). In the meantime, to ensure continued support, we are displaying the site without styles and JavaScript.
- View all journals
- My Account Login
- Explore content
- About the journal
- Publish with us
- Sign up for alerts
- Open access
- Published: 12 April 2024
Tsunami deposits highlight high-magnitude earthquake potential in the Guerrero seismic gap Mexico
- María Teresa Ramírez-Herrera ORCID: orcid.org/0000-0001-6131-0246 1 ,
- Néstor Corona ORCID: orcid.org/0000-0001-5511-2518 2 ,
- Jan Černý ORCID: orcid.org/0000-0003-3436-5350 1 ,
- Krzysztof Gaidzik ORCID: orcid.org/0000-0003-3286-0833 3 ,
- Daisuke Sugawara ORCID: orcid.org/0000-0003-0025-4011 4 ,
- Steven L. Forman ORCID: orcid.org/0000-0002-2080-7915 5 ,
- María Luisa Machain-Castillo ORCID: orcid.org/0000-0002-4973-4967 6 &
- Avto Gogichaishvili 7
Communications Earth & Environment volume 5 , Article number: 198 ( 2024 ) Cite this article
2250 Accesses
60 Altmetric
Metrics details
- Geomorphology
- Natural hazards
- Sedimentology
Globally, the largest tsunamigenic earthquakes have occurred along subduction zones. Devastating events exceeding magnitude 9, such as those in Chile, Sumatra, and Japan, struck in regions lacking instrumental records of similar events. Despite the absence of such events along the 1000-kilometer-long Mexican subduction zone, historical and geologic evidence suggests the occurrence of a magnitude 8.6 tsunamigenic earthquake. However, the Guerrero seismic gap has not experienced a high-magnitude earthquake in over 100 years. Here we present results on analyses of sediment grain size, geochemistry, microfossils, magnetic properties, and radiometric and optical stimulated luminescence dating conducted along the Guerrero coast. We provide evidence of a 2000-year history of large tsunamis triggered by potentially large earthquakes. Numerical modeling supports our findings, indicating a magnitude >8 event around the year 1300 in the Guerrero seismic gap. This evidence underscores the importance of assessing earthquake and tsunami potential using long-term evidence and instrumental observations along subduction zones globally.
Sand deposits reveal great earthquakes and tsunamis at Mexican Pacific Coast
María-Teresa Ramírez-Herrera, Néstor Corona, … Ana-Carolina Ruiz-Fernández

Potentially large post-1505 AD earthquakes in western Nepal revealed by a lake sediment record
Z. Ghazoui, S. Bertrand, … P. A. van der Beek

Link between the Nankai underthrust turbidites and shallow slow earthquakes
Jin-Oh Park & Ehsan Jamali Hondori
Introduction
High-magnitude ( > 8 Mw) earthquakes and megaearthquakes ( ≥ 9 Mw) often occur along subduction zones, e.g., Chile in 1960, Sumatra in 2004, and Japan in 2011. The Guerrero seismic gap (GSG), an approximately 200 km-long part of the Mexican subduction zone (MSZ), is known for low seismic activity (Fig. 1a, b ). A proposed plausible rupture of the entire gap could generate an earthquake of Mw = 8.4 1 . An earthquake scenario of such magnitude would affect the Mexico City metropolitan area with more than 22 million people. A catastrophic tsunami accompanying this earthquake could cause considerable damage to coastal communities such as Acapulco, among others. Recent hypothesis suggest that the rheology on the GSG of the MSZ promotes slow slip over fast slip, with earthquake generation at the plate interface 2 . However, this hypothesis is based on an incomplete assessment of tsunamigenic earthquakes historically and in the late Holocene. Indeed, in other subduction zones, where initially the earthquake and tsunami hazard was underestimated, large earthquakes and tsunamis have occurred in the past leaving their signature in the geologic record and proving the tsunamigenic and earthquake potential of these subduction zones, such as the Japan 3 , Chile 4 , Sumatra 5 , and Cascadia 6 subduction zones.

a Large earthquakes (M > 6.5) of the last century and rupture areas along the Mexican subduction zone, the image shows topographic roughness on the subducting Cocos plate, b Map shows surveyed sites 55 km alongshore the Guerrero seismic gap. Location of studied sites and two parallel transects of studied pits, c Detail of studied SSW-NNE transect of pits from pit 255 to pits A1 and A2 from the shoreline – inland on the Guerrero coast. Sources for Fig. 1 images and every element of these images come from: Base map - World Ocean Base provided by the Esri, Garmin, GEBCO, NOAA NGDC, and other contributors; for Fig. 1c, background aerial image - Google Earth and Maxar Technologies, 2023. Maps and every element of these maps were created by coauthors N. Corona and K. Gaidzik, using the software Adobe Illustrator and Corel; Fig. 1a. was built on ArcGis 10.8. Earthquake epicenters and historical rupture areas data source is available at https://usuarios.geofisica.unam.mx/vladimir/images/EQ_map_2013_es_clear.jpg .
Here, we present geologic evidence that reveals a ca. 2000-year history of large tsunamis and demonstrate that these tsunami events triggered by probable local earthquakes occurred in the past in the GSG, and modeling supports a Mw > 8 large tsunamigenic earthquake with a probable long and variable occurrence. Our data suggest a likelihood for their future occurrence.
Coastal and offshore morphology
The Guerrero seismic gap of the MSZ, between Acapulco and Petatlán (Fig. 1a ), has been defined as a morphotectonic zone 7 characterized onshore by a series of coastal lagoons, sand bars, beach ridges, alluvial plains, and rocky promontories 8 . The morphology offshore shows a narrow shelf, 7–12 km in width 9 , and a trench extending ~70 km from the coastline. Several morphologic features characterize the rough offshore topography, e.g., popped-up mountains, seamounts, ridges, and escarpments, which are associated in other regions with shallow megathrust earthquakes and tsunamis 10 , 11 . The coast near Acapulco is wave-dominated and microtidal, ranging from 0.6 m to −0.3 m 12 .
We focused on a low coastal alluvial plain in search for evidence of historical and prehistorical tsunamis and their triggering earthquakes (Fig. 1b, c ). Previous studies infer late- and mid-Holocene earthquakes and associated tsunamis 8 , 13 . Here, we describe sites with excavations at a shoreline-normal transect (Fig. 1b, c ), a total of 38 sites were examined (Fig. 2a and Supplementary Table S1 ), with a focus on the A1 and A2 sites. The A1 site is located on a lowland, covered by grasses, at the edge of an ancient estuary partially fringed by mangroves, and ~2 m above mean sea level (AMSL). Seaward, the landscape is represented by a series of beach ridges and swales, swamps, mangrove marshes, sand dunes up to 5 m, and a steep beach (Fig. 2a ). Site A2 is located along the same transect as site A1 and in a similar geomorphic setting but with a slightly higher upslope (Fig. 2a ).

a Topographic profile and Transect with sites 253 to A1 and A2 showing lab-based logged stratigraphy. Correlated sand units are marked with blue lines and dashed lines at the sites. Sand units 2, 3, 4, and 5 represent tsunami events of the last 2000 years (for dater refer to Supplementary Tables S2 , S3 , and S 4 ). b Synoptic results of microfossil analyses for site A1. Colors indicate depositional environments. The relative abundance of diatoms is given as a percent of the total count. Yellow belts show inferred tsunami events correlated with A1 stratigraphic column corresponding to sand units 2, 3, 4, and 5. c Site A1 anisotropy of magnetic susceptibility (AMS), magnetic fabrics, and magnetic susceptibility plotted together with the stratigraphic column. Yellow belts show sand units 2, 3, 4, and 5 represent tsunami events. AMS Fabric I and III show flow direction and high energy flooding events – tsunamis.
Results and Discussion
Geologic evidence of large tsunamis and their probable local earthquakes.
We discovered evidence for past large tsunamis and probable local earthquakes that provides a needed context to evaluate the potential for future equivalent events in this sector of the MSZ. The local geology and topography indicate that the study site is currently in an estuary at a distance of ∼ 800 m from the shoreline and 2 m above sea level (Fig. 2a ), providing a higher preservation potential of tsunami deposits.
Three sand units are revealed by stratigraphic logs for sites 255, 248, 247, 246, 261, 256, 262, A1 and A2 and grain size analysis (Supplementary Fig. S1 ), and traces of them along the transect from the shoreline-inland at 9 sites (Fig. 1c ), and at 25 sites alongshore ~55 km (Fig. 1b, c , Supplementary Table S1 ) that may be associated with past tsunami events. Sand unit 1 in log A2 (Fig. 2a ) is apparently an artifact produced by landscape denudation from recent human activities and yields a near modern 14 C age of 1989–1992 cal AD (Supplementary Tables S2 – S4 ). Radiocarbon ages are inverted with depth and may reflect burrowing and bioturbation 14 . Sand unit 2 is observed at both the A1, A2, and all sites but site 253 (Fig. 2a ), and contains unique taxa of marine diatoms that are absent in units above and below (Fig. 2b ). These diatoms are not well preserved and are scarce, and laboratory procedures have been used to enhance diatom detection 15 . Furthermore, the elemental composition of this unit shows an increase in Na, Mg, Ca, Br, and Ba, indicating a marine influence (Supplementary Fig. S2 ). The clay unit below also shows abundant diatoms indicative of a brackish environment, while the clay with the sand unit above shows a significant decrease in brackish diatoms, from 60% to 10%, suggesting a land-level change, probably with coastal coseismic uplift (Fig. 2b ).
The anisotropy of magnetic susceptibility (AMS) was used to characterize the sediment fabric, confirm the occurrence of a high-energy event, and reconstruct the flow characteristics of a suspected tsunami. AMS results show magnetic fabric (MF I) with a considerable degree of anisotropy P and anomalous orientation of K 1 (not perpendicular to the shoreline) in sand unit 2 (Fig. 2c ), suggesting deposition in a high-energy environment during a tsunami inundation event. River inundation is excluded by the presence of marine diatoms and geochemical salinity indicators. This interpretation is consistent with a considerable increase in magnetic susceptibility at the bottom of unit 2, reflecting swash processes sorting for the heavier magnetic grains, with a linear decrease upward, as depositional energy slackens, as normal grading of the unit (Fig. 2c ). The different mechanical properties of sediments (particle size and shape) likely explain why K 1 lacks reorientation perpendicular to the MF flow direction, despite exhibiting a higher degree of anisotropy. MF II from the clay unit below is typical of sedimentary MF of a low-energy depositional environment with mixed horizontal K 1 and K 2 components and a low degree of anisotropy P 15 . Radiocarbon ages from sand unit 2 at both A1 and A2 sites (Fig. 2a ) yielded similar ages of 1955–1956 cal AD and 1954–1955 cal AD (Supplementary Table S3 ), respectively. Instrumental records, seismic and tide gauge 16 , report three earthquakes and tsunamis in the late 1950s to early 1960s that may be related to this sand deposit. The M 7.8 earthquake produced a tsunami near Acapulco in 1957, although tide gauge data at the Acapulco port did not confirm a permanent uplift produced by this earthquake 16 . The 11 May 1962 (M 7.1) and 19 May 1962 (M 7.0) tsunamigenic earthquakes (Fig. 1a ) produced permanent uplift of 15 ± 3 cm and 7 ± 3 cm during these events in the Acapulco region 16 . Sand unit 2 is likely associated with the 1957 earthquake and tsunami, even though we have not absolute certainty about which one of the three events caused the permanent coastal uplift, the 1957 event likely produced coastal uplift.
Sand Unit 3 is observed on both A1 and A2, and at 20 more sites (Fig. 2a , Supplementary Table S1 ) and shows a sharp basal contact and flame structures indicating syndepositional soft-sediment deformation. This unit also includes broken shells and fragmented and whole marine diatom valves (Fig. 2b ), suggesting marine inundation by a tsunami. Anisotropy of magnetic susceptibility analysis (AMS) of this unit shows a slight reorientation tendency of K 1 to the perpendicular position and a slightly higher degree of anisotropy P suggest that sand unit 3 was deposited in a higher-energy environment 17 , 18 , 19 , 20 (Fig. 2c ). Sediments above sand unit 3 are composed of clayish silt (Supplementary Fig. S1 ) with predominantly brackish diatoms ( > 40%), while sediments below are composed of fine sand with less fragmented diatom valves and few brackish diatoms ( < 5%) (Fig. 2b ). This sudden change in the environment suggests land subsidence. Based on the analysis of diatoms in the current topography and coastal environments at the site (Fig. 2a, b and Supplementary Fig. S3 ), the drop in land level could be equivalent to a change from a beach ridge elevation to an estuary or a swale elevation, likely a subsidence in the range of ≥ 1 m. We suggest that a large earthquake, ~Mw > 8, produced the observed coseismic coastal subsidence and triggered a tsunami, flooding at least 800 m inland. We used both the geologic record of the earthquake (coastal deformation) and of the tsunami, together with earthquake rupture and tsunami modeling scenarios to estimate an approximate magnitude. The age of this event through OSL dating of quartz grains indicates that this tsunami, triggered by a local potential earthquake, occurred between 1240 and 1370 AD (Supplementary Table S4 ). The 15th century witnessed the occurrence of earthquakes, which are documented in the earliest historical texts written in Spanish 21 . Additionally, the oldest recorded historical event that caused a tsunami on the GSG dates to 1537 AD 22 . Thus, historical records do not, but our results using different proxies demonstrate that a large tsunamigenic earthquake occurred on the Guerrero coast between 1240 and 1370 AD.
Sand unit 4 is composed mainly of fine sand and shows a sharp basal contact with black sandy silt below. It contains shell fragments and brackish and marine diatoms, with some plant debris, suggesting a marine flooding event. The sediment layer above sand unit 4 consists of fine sand with a minor presence of brackish diatoms ( < 4%). Conversely, the sediments beneath sand unit 4 show an ascending prevalence of brackish to marine diatoms as one moves down into the core. This transition indicates a shift in the environment, likely attributed to a change in land level—potentially uplift. While the precise timing of this occurrence remains uncertain, it is estimated to predate the period of 1240–1370 AD (Fig. 2a , b and Supplementary Table S4 ).
Finally, the lowest deformed sand unit 5 with sharp basal contact, shell fragments, and marine diatoms (although diatoms are scarce) suggests probable marine inundation. Deformation of this unit indicates an apparent liquefaction event, most likely produced by an earthquake before 590–666 Cal AD and after 485–359 Cal BC (Fig. 2a, b and Supplementary Table S3 ).
Our interpretation considers various factors influencing the observed changes in the depositional environment and microorganism habitat. While we acknowledge the possibility of secondary processes playing a role, our focus on the tsunami as the primary driver is supported by multiple lines of evidence, including sedimentology, diatom analysis, and topographical comparisons. We recognize the dynamic nature of coastal settings and the potential for natural processes to influence them, but the combination of evidence supports our interpretation of a tsunami-induced shift in the coastal environment.
Coastal land-level changes and variable occurrence of large events
We maintain confidence in the robustness of our findings regarding the chronological sequence of events and their association with land-level changes. Herein, we provide additional elaboration. 1) Our detailed chronology related to sand unit 2 lends robust support to our interpretations. Radiocarbon dating of sand unit 2 from both the A1 and A2 sites yielded closely aligned dates of 1955–1956 cal AD and 1954–1955 cal AD. 2) We have expounded above upon the relationship between sand unit 2 and the adjacent units, namely the underlying clay unit containing abundant diatoms characteristic of a brackish environment, and the overlying clay-sand unit which displays a substantial decrease in brackish diatoms. This transition suggests a shift in land elevation, potentially indicative of coastal uplift. 3) Our proposition of sudden coastal uplift is not solely based on the diatom composition within the core, but also on our comprehensive analysis of topography and diatom content in various analogous modern environments along the same transect (Refer to Fig. S3 ). Comparison with modern analogs reveals a prevalence of brackish diatoms in low-lying regions such as ponds, swales, and estuaries. Contrasting with this, our core demonstrates a sharp reduction from 60% brackish diatoms in the unit below the sand layer to only 10% in the clay-silt layer above, implying a transition from a swale or estuarine condition to drier surroundings, indicative of coastal uplift. 4) Furthermore, we highlight instrumental data affirming a coastal uplift of 15 + / − 3 cm and 7 + / − 3 cm attributable to local events, specifically the tsunamigenic earthquakes of May 11, 1962 (M7.1) and May 19, 1962 (M7.0). Notably, a M7.8 tsunamigenic earthquake occurred in 1957, although there is no instrumental record indicating concurrent land-level change. We propose that both the earthquake and the resultant tsunami could plausibly be linked to the M7.8 event in 1957. In essence, while we lack absolute certainty about which of the three events triggered the permanent coastal uplift, we have integrated this understanding into our explanations above.
We have examined a total of 38 sites, to address the question of a broad representation of evidence for land-level change, employing various methods such as cores, geoslices, pits, and hang-auger surveys to gather a comprehensive dataset. It is all included in Fig. 2a and Supplementary Table S1 . Figure 2a and Supplementary Table S1 present the stratigraphy at each individual site, providing valuable insights into the sedimentary layers and changes observed. Furthermore, we have included information about the transition from intertidal to subtidal conditions, which can serve as a compelling indicator of land-level change. Please refer to Supplementary Fig. S3 .
In summary, our investigation has yielded evidence of four tsunamis and potential associated earthquakes. However, it is important to acknowledge that the age of one of these events (sand unit 4) remains inconclusive. Among the identified events, only the third event, characterized by the presence of sand unit 3, exhibits clear indications of permanent and notable deformation, specifically coastal subsidence. For the remaining three events, there appears to be evidence of minor uplift or modest, non-permanent deformation. The maximum inland extent of tsunami deposits and the calculation of the maximum tsunami flooding limit based on the distribution of associated deposits on the surface is a conservative estimate. Factors such as the sediment source and preservation of deposits over time affect this calculation 23 , 24 , 25 , 26 . Thus, the observed 800 m inland extent of tsunami deposits is a small estimate of the maximum inland tsunami inundation limit. The time frame of these events shows that occurrence has been highly variable for the past ca. 2000 years (Fig. 2a, b and Supplementary Tables S2– S4 ). However, this record is an estimate of tsunamigenic earthquake occurrence in the past. Nevertheless, the “1300 AD” event (unit 3) is likely a remarkable event that produced considerable coastal deformation ( ~ 1 m subsidence) and may reflect a rupture closer to the trench. Most instrumentally recorded events on the MSZ rupturing near the coast produced coastal uplift for earthquakes in 1962, 1985, and 2020 16 , 27 , 28 . However, other large near-trench earthquake events (within 20 km) causing seismic slip in the shallow portion of the MSZ, such as Colima 1995 and Jalisco 1932, produced coseismic coastal subsidence 29 , 30 , 31 , 32 . Earthquake ruptures near the trench cause vertical coseismic displacement and uplift, generating tsunamis 33 . Near-trench events in the GSG are relatively common, such as the 2002 Mw6.7 near-trench tsunami earthquake, which produced a limited tsunami response ( < 10 cm) 34 .
Earthquake rupture modeling scenarios aided in to evaluate of coseismic deformation, using various models based on different factors such as fault plane distance from the coastline, magnitudes, and rupture areas. Results showed that fault planes near the coastline caused coastal uplift, while those farther away gradually shifted to subsidence beyond 20 km offshore (Supplementary Fig. S4 ). Earthquakes with magnitudes Mw > 8.2, located over 20 km from the coastline, led to subsidence. Models T4 and T5 were identified as suitable for generating coastal subsidence values between 1–2 m, and model T5 is a better fit (Fig. 3a , Supplementary Figs. S4 and S5 ), consistent with our geological records.

a Fault rupture and coseismic deformation model, and tsunami model of a hypothesized Mw 8.6 earthquake near the trench producing a tsunami with amplitudes over 10 m at the coast and inundation over 1 km inland at the studied area A1 ( a–c ); ( b ) Close-up to tsunami inundation depths at the studied area where sites preserved tsunami deposits from the 1300 AD tsunamigenic earthquake and other 3 events. c Model of maximum tsunami wave amplitudes generated by best fit modeled earthquake scenario of Mw 8.6 (See Supplementary Figs. S4 and S5 ). d Tsunami amplitudes along places on the Guerrero seismic gap of the Pacific coast of Mexico. Source: a and c composed on Surfer 16. The background shaded image was produced from the gridded bathymetric data set by GEBCO_2023 Grid available at: https://www.gebco.net/data_and_products/gridded_bathymetry_data/#global . c The background shaded relief model corresponds to the 5 m LIDAR grid model provided by INEGI and available at: https://www.inegi.org.mx/app/biblioteca/ficha.html?upc=889463542391 . The software Surfer 16 was used to composite the flooding map.
Regarding maximum tsunami amplitudes, models with a magnitude around 8.6 directly in front of site A1 achieved amplitudes exceeding 10 m (Fig. 3c, d and Supplementary Fig. S5b, c ). Shifting the fault plane to the southeast or northwest substantially reduced these amplitudes (Supplementary Fig. S5b ). Scenario T5 mets the criteria for generating maximum tsunami amplitudes capable of inundating site A1, i.e., more than 1 km inland (Fig. 3b ). Thus, tsunami modeling of a hypothesized near-trench Mw8.6 earthquake produces tsunami amplitudes over 10 m at the coast and inundation over 1 km inland in the study area. This model fits long-term evidence of a Mw > 8 earthquake and a tsunami that flooded > 1 km inland (Fig. 3 ).
Furthermore, based on the information provided, ruptures along neighboring segments are unlikely to produce similar tsunami deposits or inundation patterns near site A1. The proximity to the coastline, as suggested by the coseismic deformation models in Supplementary Fig. S4 , indicates a higher likelihood of coastal uplift rather than subsidence. Additionally, as shown in Supplementary Fig. S5b , even earthquakes with magnitudes greater than 8.3, such as in T9 scenario, do not generate amplitudes capable of inundating A1. Furthermore, historical evidence from earthquakes like Jalisco 1932 (Mw8.2), Michoacan 1985 (Mw8.1), and Oaxaca 1785 (M8.6) does not suggest the occurrence of subsidence or flooding capable of causing the observed tsunami deposits at A1 in the Guerrero Seismic Gap. Therefore, it is unlikely that ruptures along neighboring segments would produce similar effects in this specific location.
Regarding the location of the newly discovered four large earthquakes, we base our certainty on a comprehensive assessment of the geologic evidence, particularly in relation to sand unit 3 and the surrounding units. These geological indicators point to an important change in land level, likely resulting from a large earthquake that ruptured near the trench and generated a sizable tsunami. This interpretation is further supported by the outcomes of our best-fit modeling. We have determined that the evidence within unit 3 strongly suggests a large-scale seismic event, one that is likely linked to the Guerrero seismic gap (GSG). Our preferred model involves a fault rupture length of 210 km and a width of 90 km, with a maximum slip of 20 m concentrated at shallow depths, at 20 km from the coast, 40 km from the trench, and at 20 km depth (scenario T5 in Table S5). In summary, our confidence in attributing the observed land-level changes to the Guerrero seismic gap (GSG) is primarily drawn from a thorough analysis of geological evidence and corroborated by our modeling outcomes.
Long-term record of earthquakes vs. short instrumental geophysical observations
Our results show geologic and historical evidence of past large earthquakes coupled with tsunamis in the last 2000 years. A potential large tsunamigenic earthquake (Mw > 8) in ~1300 AD, i.e., is substantially larger than that recorded instrumentally and observed during the past ca. 110 years. The ages for the four tsunami-indicative sand units are younger than the mid-Holocene sea-level highstand, and sea-level records for the past 2 ka show little to mild changes in sea level, < 1 mm/year, until the late mid-19 th century when sea level increased 35 . Previous work on this segment of the MSZ also provided evidence for apparent older earthquakes, probably 3 tsunami events during the past 4600 BP years 8 , 13 . Evidence of another large earthquake that produced land subsidence accompanied by marine inundation, most likely a tsunami, by c . 3400 yr BP, was reported on the Guerrero coast 8 . The neighboring Oaxaca segment shows historical and geologic evidence of a Mw8.6 earthquake and tsunami in the 1787 flooding > 500 km alongshore and up to > 6 km inland 36 .
Recent geologic evidence provides new insights into extraordinary catastrophic events in the Mexican subduction zone. The occurrence of large events might be in the range of centuries. Our observations also indicate that indeed subduction zones might have variable rupture modes. The GSG and other segments on the MSZ and other subduction zones require combined long-term and instrumental observations to forewarn eventual catastrophes. Our findings offer evidence to prepare communities for earthquake and tsunami hazards.
Field survey
Field exploration and reconnaissance were performed during several seasons and years, looking for the potential environments that would preserve tsunami deposits. We worked on salt marshes, estuaries, swales between beach ridges, and swamps along 55 km of the coast of the Guerrero segment and used a hang huger, geoslicer, and pits at more than 35 sites (Fig. 1b , Supplementary Table S1 ). We found evidence of tsunami deposits near estuaries, dug, and collected geoslices as far as 800 m landward (Figs. 1 b–c, 2a ).
Stratigraphic and sediment analysis
We constructed stratigraphic cross sections using geoslices and pits (Fig. 2a ). Focus was given to sites 9 sites, and at A1 and A2 for further sediment analysis, including grain size, diatoms, geochemistry, and different dating techniques 37 . Site A1 was used to study magnetic properties, including magnetic susceptibility and anisotropy of magnetic susceptibility (AMS).
Diatom analysis
Samples for microfossil (diatoms) analyses were collected from site A1. One gram of dry sediment was sampled from each horizon and dispersed in 10% hydrochloric acid to remove carbonates. Later, these samples were neutralized and dispersed in distilled water. Thin sections were made with 400 μl of liquid dispersion for each slide. Counts of valves were undertaken with a Carl Zeiss (series 470801–9097) microscope, and species composition is reported as total abundance recognized in the slides. Diatom fragments were counted on the same area in all samples under oil immersion with a magnification of 100x; however, diatom valves in some samples (sand layers and clay bed between 21 and 45 cm in A1) were investigated in various thin sections from the same horizons due to scarce diatoms in these horizons. A coarse fraction, larger than the diatom size, was extracted from sand beds before the preparation of thin sections to increase the number of possible findings. Each specimen counted no less than half a valve. We identified and counted 1420 diatom valves from site A1. The environmental preferences of the diatoms were determined based on the literature (Supplementary Information - Supplementary Notes 1 ). Microfossil diagrams were created using Tilia software 38 .
Anisotropy of magnetic susceptibility analysis
Samples for magnetic susceptibility measurements were collected along a continuous vertical profile from A1 every 2 cm into plastic boxes with a volume of 7 cm 3 . Some fabrics were verified in the field by taking natural samples from a pit wall at site A1 because of fabric deformation during coring. Only natural and original fabrics from 4 different units were preserved at site A1. All AMS measurements were conducted using the MFK1-FA Kappabridge device (applied field of 200 A/m) and using a 3D rotator 39 . Principal susceptibility directions K 1 , K 2 , and K 3 correspond to maximum, intermediate, and minimum susceptibility directions, respectively. AMS parameters T (shape parameter) and P (degree of anisotropy) have been defined by Jelinek 40 , 41 .
210 Pb dating and elemental composition, OSL and C14 analysis
We used the same technique described by Ramirez-Herrera et al. 36 for elemental composition analysis and 210Pb chronology. The top sediment sequence, from 1 to 25 cm, of which only the first 16 cm was measured for this purpose, the rest were beyond the range of datable material using the CFCS model. Thus, the dated sequence was very young, 40 years old (Supplementary Table S2 ). Fourteen samples for radiocarbon dating were measured and dated at the Beta Analytic Laboratory (Supplementary Table S3 ).
Optical stimulated luminescence (OSL) analysis was performed at the Geoluminiscence Research Dating Lab facility at Baylor University. The collection of samples was performed as described by the facility ( https://www.baylor.edu/geosciences/index.php?id=955930 ). Three samples were measured for OSL dates (Supplementary Table S4 ).
It is important to note that various dating methods often complement each other, contributing to a more robust chronological framework. In similar studies, multiple dating techniques have been successfully addressed different aspects of sedimentary sequences. Pb210 dating is suitable for younger sediments, OSL is effective for tsunami deposits, and C14 is utilized when organic matter is present. When combined, these methods enhance the reliability and accuracy of the chronological interpretation. Therefore, integrating multiple techniques is a well-established practice in sedimentary research using Pb210, C14, and OSL methods to date tsunami deposits 42 , 43 , 44 .
Tsunami modeling
Tsunami modeling was computed using the Funwave code 45 . A hypothetical Mw = 8.6 earthquake was positioned in the middle of the Guerrero segment and defined with a rupture area of 210 × 90 km 2 at a depth of 20 km (detailed input in Supplementary Table S5 ). The first step in the code, TOPICS, solves the initial coseismic deformation and transfers it to the free water surface. This step is driven by the elastic half-space formulation of Okada 46 . The propagation and inundation modeling were solved by a subroutine module based on a fully nonlinear Boussinesq model. The simulation time was established at 120 min at one-minute intervals. The input for the propagation and inundation tsunami model was the topo-bathymetric model version GEBCO_2022, provided for GEBCO Compilation Group, GEBCO_2022 Grid a Global grid 47 of elevation values in meters on a 15 arc-second interval grid, equivalent to ca. 453 m, and land topographic data from a 5 m LIDAR Digital Terrain Model.
Data availability
All information and data that are necessary to interpret, verify, and extend the research in the article are provided in the form of Supplementary Information. The data sets supporting tsunami modeling, sedimentology, and geochemical data presented in Fig. 3d and Supplementary Figs. S1 , S2 , S4, and S5 , are publicly available on the Zenodo repository, as part of this record with the identifier: https://doi.org/10.5281/zenodo.10732215 .
Code availability
The FUNWAVE tsunami code can be fully accessed with no restrictions at https://fengyanshi.github.io/build/html/setup.html#download-source-code . No new computer code was written in preparing the paper.
Suarez, G., Montfret, T., Wittlinger, G. & David, C. Geometry of subduction and depth of the seismogenic zone in the Guerrero gap, Mexico. Nature 345 , 336–338 (1990).
Article Google Scholar
Husker, A., Ferrari, L., Arango-Galván, C., Corbo-Camargo, F. & Arzate-Flores, J. A geologic recipe for transient slip within the seismogenic zone: Insight from the Guerrero seismic gap, Mexico. Geology 46 , 35–38 (2018).
Sawai, Y., Namegaya, Y., Okamura, Y., Satake, K. & Shishikura, M. Challenges of anticipating the 2011 Tohoku earthquake and tsunami using coastal geology. Geophys. Res. Lett. 39 , L21309 (2012).
Cisternas, M. et al. Predecessors of the giant 1960 Chile earthquake. Nature 437 , 404–407 (2005).
Article CAS Google Scholar
Monecke, K. et al. A 1000-year sediment record of tsunami recurrence in northern Sumatra. Nature 455 , 1232–1234 (2008).
Atwater et al. Summary of coastal geologic evidence for past great earthquakes at the Cascadia subduction zone. Earthq. Spectra 11 , 1–18 (1995).
Ramı́rez-Herrera, M. T. & Urrutia-Fucugauchi, J. Morphotectonic zones along the coast of the Pacific continental margin, southern Mexico. Geomorphology 28 , 237–250 (1999).
Ramírez-Herrera, M. T. et al. Sedimentary record of late Holocene relative sea-level change and tectonic deformation from the Guerrero seismic gap, Mexican Pacific coast. Holocene 17 , 1211–1220 (2007).
Černý, J., Ramírez-Herrera, M. T., Garcia, E., Ito, Y. Seafloor morphology along the active margin in Guerrero, Mexico: probable earthquake implications. J. South Am. Earth Sci. 102 , 1–10 (2020).
Bell, R., Holden, C., Power, W., Wang, X. & Downes, G. Hikurangi margin tsunami earthquake generated by slow seismic rupture over a subducted seamount. Earth Planet. Sci. Lett. 397 , 1–9 (2014).
Prada, M., Bartolomé, R., Gras, C., Bandy, W. & Dañobeitia, J. J. Trench-parallel ridge subduction controls upper-plate structure and shallow megathrust seismogenesis along the Jalisco-Colima margin, Mexico. Commun. Earth Environ. 4 , 53 (2023).
Servicio Mareográfico Nacional: https://chalchiuhtlicue.geofisica.unam.mx/ (2024).
Ramírez-Herrera, M. T., Cundy, A. & Kostoglodov, V. Probables sismos y tsunamis prehistóricos durante los últimos 5000 años en la costa de la brecha sísmica de Guerrero, México. XV CNIS Sociedad Mexicana de Ingeniería Sísmica. I 07:1-17 (2005).
Dolman, A. M., Groeneveld, J., Mollenhauer, G., Ho, S. L. & Laepple, T. Estimating bioturbation from replicated small‐sample radiocarbon ages. Paleoceanography and Paleoclimatology 36 , e2020PA004142 (2021).
Černý, J., Ramírez-Herrera, M. T. & Caballero, M. Procedures for diatom analyses and hydrodynamic separation of extreme wave paleo-deposits from tropical sediment environments. Mar. Geol. 455 , 106970 (2023).
Ortiz, M., Singh, S. K., Kostoglodov, V. & Pacheco, J. Source areas of the Acapulco-San Marcos, Mexico earthquakes of 1962 (M 7.1; 7.0) and 1957 (M 7.7), as constrained by tsunami and uplift records. Geofís. Int. 39 , 337–348 (2000).
Google Scholar
Wassmer, P. et al. Use of anisotropy of magnetic susceptibility (AMS) in the study of tsunami deposits: application to the 2004 deposits on the eastern coast of Banda Aceh, North Sumatra, Indonesia. Mar. Geol. 275 , 255–272 (2010).
Cuven, S. et al. High-resolution analysis of a tsunami deposit: case-study from the 1755 Lisbon tsunami in southwestern Spain. Mar. Geol. 337 , 98–111 (2013).
Schneider, J. L. et al. Using magnetic fabric to reconstruct the dynamics of tsunami deposition on the Sendai Plain, Japan – The 2011 Tohoku-oki tsunami. Mar. Geol. 358 , 89–106 (2014).
Černý, J., et al. Magnetic record of extreme marine inundation events at Las Salinas site, Jalisco, Mexican Pacific coast. Int. Geol. Rev. 58 , 342–357 (2016).
Suárez, G. Catálogo de Sismos Históricos de México. http://www.sismoshistoricos.org/ (2021).
Ramírez-Herrera, M.-T., Corona, N. & Suárez, G. A Review of Great Magnitude Earthquakes and Associated Tsunamis along the Guerrero, Mexico Pacific Coast (eds M. Chavez, M. Ghil and J. Urrutia-Fucugauchi) 165–176, ch. 13 (AGU, 2015).
Abe, T., Goto, K. & Sugawara, D. Relationship between the maximum extent of tsunami sand and the inundation limit of the 2011 Tohoku-oki tsunami on the Sendai Plain, Japan. Sediment. Geol. 282 , 142–150 (2012).
Abe, T., Goto, K. & Sugawara, D. Spatial distribution and sources of tsunami deposits in a narrow valley setting-insight from 2011 Tohoku-oki tsunami deposits in northeastern Japan. PEPS 7 , 1–21 (2020).
Moreira, S. et al. High resolution geochemical and grain-size analysis of the AD 1755 tsunami deposit: insights into the inland extent and inundation phases. Mar. Geol. 390 , 94–105 (2017).
Shinozaki, T. et al. Identifying tsunami traces beyond sandy tsunami deposits using terrigenous biomarkers: a case study of the 2011 Tohoku-oki tsunami in a coastal pine forest, northern Japan. PEPS 9 , 1–10 (2022).
Bodin, P. & Klinger, T. Coastal uplift and mortality of intertidal organisms caused by the september 1985 Mexico earthquakes. Science 233 , 1071–1073 (1986).
Ramírez-Herrera, M. T., Romero, D., Corona, N., Nava, H. The 23 June 2020 Mw 7.4 La Crucecita, Oaxaca, Mexico earthquake and tsunami: a rapid response field survey during COVID‐19. Crisis. Seismol. Res. Lett . 92 , 26–37 (2020).
Cumming, J. L. Los terremotos de Junio de 1932 en los estados de Colima y Jalisco. Universidad de México 6 , 68–104 (1933).
Hutton, W., DeMets, C., Sanchez, O., Suarez, G. & Stock, J. Slip kinematics and dynamics during and after the 1995 october 9 Mw= 8.0 Colima–Jalisco earthquake, Mexico, from GPS geodetic constraints. Geophys. J. Int. 146 , 637–658 (2001).
Hjörleifsdóttir, V. et al. Was the 9 october 1995 Mw 8 Jalisco, Mexico, earthquake a near-trench event? J. Geophys. Res. Solid Earth 123 , 8907–8925 (2018).
Pacheco, J. et al. The october 9, 1995 Colima-Jalisco, Mexico earthquake (Mw 8): an aftershock study and a comparison of this earthquake with those of 1932. Geophys. Res. Lett. 24 , 2223–2226 (1997).
Kanamori, H. & Kikuchi, M. The 1992 nicaragua earthquake: a slow tsunami earthquake associated with subducted sediments. Nature 361 , 714–716 (1993).
Flores, K., Hjorleifsdottir, V., Iglesias, A. & Singh, S. Did the Long Duration, April 18, 2002 (Mw 6.7), Mexico Earthquake Break the Guerrero Gap. AGU Fall Meeting Abstracts 2016, S53A–S52803; 2016AGUFM.S53A2803F https://agu.confex.com/agu/fm16/meetingapp.cgi/Paper/186208 (2016).
Kemp, AndrewC. et al. Climate related sea-level variations over the past two millennia. PNAS USA 108 , 11017–11022 (2011).
Ramı́rez-Herrera, M.-T. et al. Sand deposits reveal great earthquakes and tsunamis at Mexican Pacific Coast. Sci. Rep. 10 , 11452 (2020).
Ramirez-Herrera, M.-T. et al. Tsunami deposits in the Guerrero Seismic Gap, Mexico: insights from location analysis, earthquake and tsunami models, and proxy dataset. Zenodo . https://doi.org/10.5281/zenodo.10732215 (2024).
Grimm E. C., Tilia software, ver. 260 (2016).
Studỳnka, J., Chadima, M. & Suza, P. Fully automated measurement of anisotropy of magnetic susceptibility using 3D rotator. Tectonophysics 629 , 6–13 (2014).
Jelinek, V. Characterization of the magnetic fabric of rocks. Tectonophysics 79 , T63–T67 (1981).
Nagata, T. Rock magnetism, 350 p. (Maruzen Company Ltd., 1961).
Brill, D. et al. Local inundation distances and regional tsunami recurrence in the Indian Ocean inferred from luminescence dating of sandy deposits in Thailand. NHESS 12 , 2177–2192 (2012).
Reinhardt, E. G. et al. The tsunami of 13 december AD 115 and the destruction of Herod the Great’s harbor at Caesarea Maritima, Israel. Geology 34 , 1061–1064 (2006).
Goodman-Tchernov, B. N., Dey, H. W., Reinhardt, E. G., McCoy, F. & Mart, Y. Tsunami waves generated by the Santorini eruption reached Eastern Mediterranean shores. Geology 37 , 943–946 (2009).
Watts, P., Grilli, S. T., Kirby, J. T., Fryer, G. J. & Tappin, D. R. Landslide tsunami case studies using a Boussinesq model and a fully nonlinear tsunami generation model. NHES 3 , 391–402 (2003).
Okada, Y. Surface deformation due to shear and tensile faults in a half-space. BSSA 75 , 1135–1154 (1985).
GEBCO_2022, GEBCO Compilation group, GEBCO_2022 Grid. https://doi.org/10.5285/e0f0bb80-ab44-2739-e053-6c86abc0289c (2022).
Download references
Acknowledgements
We thank Tina Dura for her feedback and valuable discussions. We are indebted to Alejandro Rodriguez R. for assisting with microfossil analysis and to Oswaldo Coca for uploading data into the Zenodo Database. AMS analysis were performed at Laboratorio Interinstitucional de Magnetismo Natural – UNAM, with assistance by Miguel Cervantes. This research project was funded by CONACYT-284365 and PAPIIT- IN107721 awarded to M.T.R-H.
Author information
Authors and affiliations.
Laboratorio de Tsunamis y Paleosismología, Instituto de Geografía, Universidad Nacional Autónoma de México, Ciudad de México, México
María Teresa Ramírez-Herrera & Jan Černý
COLMICH, Centro de Estudios de Geografía Humana, La Piedad, Michoacán, México
Néstor Corona
Institute of Earth Sciences, University of Silesia, Katowice, Sosnowiec, Poland
Krzysztof Gaidzik
International Research Institute of Disaster Science, Tohoku University, Tohoku, Japan
Daisuke Sugawara
Department of Geosciences, Baylor University, Waco, Texas, USA
Steven L. Forman
Instituto de Ciencias del Mar y Limnología, Universidad Nacional Autónoma de México, Ciudad de, México, México
María Luisa Machain-Castillo
Instituto de Geofísica Unidad Morelia, Universidad Nacional Autónoma de México, Morelia, Michoacán, México
Avto Gogichaishvili
You can also search for this author in PubMed Google Scholar
Contributions
M.T.R-H. conceived and carried out the research, data acquisition, lab analyses, and wrote the manuscript. N.C. carried out tsunami and earthquake modeling, created all final figures, and helped with the manuscript revision. J.C. performed diatom and AMS analysis and contributed with the related sections of an early version of this manuscript. K.G. drafted a figure, aided in data interpretation and manuscript revision. D.S. aided in initial subsampling, helped with data interpretation in the field. All authors mentioned above participated in the fieldwork. S.L.F. carried out OSL analysis. M.L.M-C. assisted with microfossil identification. A.G. assisted with AMS analysis. All authors revised the manuscript.
Corresponding author
Correspondence to María Teresa Ramírez-Herrera .
Ethics declarations
Competing interests.
The authors declare no competing interests.
Peer review
Peer review information.
Communications Earth and Environment thanks the anonymous reviewers for their contribution to the peer review of this work. Primary Handling Editor: Joe Aslin. A peer review file is available.
Additional information
Publisher’s note Springer Nature remains neutral with regard to jurisdictional claims in published maps and institutional affiliations.
Supplementary information
Peer review file, supplementary information, rights and permissions.
Open Access This article is licensed under a Creative Commons Attribution 4.0 International License, which permits use, sharing, adaptation, distribution and reproduction in any medium or format, as long as you give appropriate credit to the original author(s) and the source, provide a link to the Creative Commons licence, and indicate if changes were made. The images or other third party material in this article are included in the article’s Creative Commons licence, unless indicated otherwise in a credit line to the material. If material is not included in the article’s Creative Commons licence and your intended use is not permitted by statutory regulation or exceeds the permitted use, you will need to obtain permission directly from the copyright holder. To view a copy of this licence, visit http://creativecommons.org/licenses/by/4.0/ .
Reprints and permissions
About this article
Cite this article.
Ramírez-Herrera, M.T., Corona, N., Černý, J. et al. Tsunami deposits highlight high-magnitude earthquake potential in the Guerrero seismic gap Mexico. Commun Earth Environ 5 , 198 (2024). https://doi.org/10.1038/s43247-024-01364-0
Download citation
Received : 03 October 2023
Accepted : 02 April 2024
Published : 12 April 2024
DOI : https://doi.org/10.1038/s43247-024-01364-0
Share this article
Anyone you share the following link with will be able to read this content:
Sorry, a shareable link is not currently available for this article.
Provided by the Springer Nature SharedIt content-sharing initiative
By submitting a comment you agree to abide by our Terms and Community Guidelines . If you find something abusive or that does not comply with our terms or guidelines please flag it as inappropriate.
Quick links
- Explore articles by subject
- Guide to authors
- Editorial policies
Sign up for the Nature Briefing newsletter — what matters in science, free to your inbox daily.

Submarine landslides and tsunami genesis in Sagami Bay, Japan, caused by the 1923 Great Kanto earthquake
- Original Paper
- Open access
- Published: 17 April 2024
Cite this article
You have full access to this open access article
- Kazuki Murata ORCID: orcid.org/0009-0004-5948-5839 1 ,
- Toshikazu Ebisuzaki ORCID: orcid.org/0000-0002-3918-1166 2 ,
- Shinji Sassa ORCID: orcid.org/0000-0002-0269-200X 1 ,
- Tomohiro Takagawa ORCID: orcid.org/0000-0002-2783-5951 1 ,
- Koichi Masuda 3 ,
- Takujiro Miyamoto 3 ,
- Masato Ohno 3 &
- Shigenori Maruyama ORCID: orcid.org/0000-0002-3439-8737 4
The 1923 Great Kanto earthquake occurred on September 1, in Japan, and caused severe damage mainly in the Kanto region. Tsunamis were observed over wide regions from the east coast of the Izu Peninsula to the west coast of the Boso Peninsula, and particularly, the damage in Atami was devastating. Many earthquake fault models including those of Kanamori (1971) and Ando (1971) were proposed based on the records of land deformation. However, such fault models cannot sufficiently explain the tsunami elevation and its initial sea-level motion on the coasts. Hence, the detailed mechanisms remain elusive. This study examines the possibility that a leading mechanism of the tsunami in the 1923 Great Kanto earthquake was a large-scale submarine landslide that occurred at Sagami Bay and at the mouth of Tokyo Bay based on the records of depth data measured by the Imperial Japanese Navy (1924) before and after the earthquake. We first show that the tsunami calculated by each fault model was inconsistent with the waveform at Yokosuka, the coastal tsunami elevations, and initial sea-level motion. Then, based on statistical analysis of the depth changes at the 1923 Great Kanto earthquake, we found that the seafloor bathymetric changes represented large-scale submarine landslides that may correspond to long-runout submarine liquefied sediment flows. The seafloor gradient over a 40 km flow-out distance was equal to or less than 0.4 \(^\circ\) . Through the identification of the submarine landslide source by tsunami backpropagation analysis and utilizing an analytical solution of a high-density gravity flow and a sensitivity analysis, we conducted a range of numerical simulations of the 1923 Great Kanto earthquake tsunamis using a fault model and a submarine landslide tsunami source model due to a high-density liquefied gravity flow. The results quantitatively accounted for the discrepancy between the observed tsunami records with maximum tsunami elevations over 12 m and the fault-model–based simulations with maximum tsunami elevations of 2 to 5 m and explained consistently the maximum tsunami elevation distributions as well as the time-series tsunami waveforms. These results may thus facilitate and deepen our understanding of the earthquake-induced submarine landslide tsunami risk as cascading multi-geohazards.
Avoid common mistakes on your manuscript.
Introduction
The 1923 Great Kanto earthquake occurred on September 1 and caused severe damage mainly in Tokyo, Kanagawa, Chiba, and Shizuoka in Japan. The earthquake struck the Kanto and the Sagami Bay area, and the moment magnitude was estimated to be M w = 7.9–8.1 (Kanamori 1971 ; Namegaya et al. 2011 ) (Fig. 1 ). The Kanto earthquake also caused severe fire damage. The number of casualties reached 100,000 (Moroi and Takemura 2004 ), and the scale of the damage was enormous compared to the 2011 Tohoku earthquake with 20,000 casualties. The following tsunami caused extensive damage along the coast from the east region of the Izu Peninsula to the west coast of the Boso Peninsula and was particularly severe in Atami such that a 12 m tsunami elevation was recorded around the coastal zone (Imperial Japanese Navy 1924 ). Ground deformations showed a marked uplift of 1.8 to 3 m along the southern Boso Peninsula, the southern tip of the Miura Peninsula and the coast of Sagami Bay. The land area around the eastern to the southern Izu Peninsula subsided from 0.3 to 0.75 m (Land Survey Department 1930 ).

a Tectonic map (yellow line, plate boundary; orange dashed line, volcanic front) and the target area of this study (red frame), which is located at a complex region adjacent to the Pacific, Philippine Sea, Okhotsk, and Eurasian plates. b The 1923 Great Kanto earthquake with M w = 7.9–8.1 is considered to have been caused by a fault movement in the Sagami Trough region (e.g., Kanamori 1971 ; Ando 1971 ). The distribution area of the Sagami Trough and the detailed epicenter map of the 1923 Great Kanto earthquake (Takemura and Ikeura 1994 ). The first earthquake occurred near Odawara, deep in Sagami Bay, and the second earthquake near the southern part of the Miura Peninsula, as shown by the two red circles. The fault area (broken blue line) extended over Tokyo, Kanagawa, and Chiba
Kanamori ( 1971 ) and Ando ( 1971 ) quantitatively analyzed the fault motion mechanism of the 1923 Kanto earthquake based on the seismic waveform data and geodetic data, including detailed fault parameters such as strike, dip, and slip. Then, a number of studies proposed detailed analysis models considering the slip and direction characteristics of the fault area (Ando 1974 ; Matsu'ura et al. 1980 ; Matsu'ura and Iwasaki 1983 ; Ishibashi 1980 , 1985 ; Wald and Somerville 1995 ; Kobayashi and Koketsu 2005 ; Namegaya et al. 2011 ; Nakadai et al. 2023 ), to reproduce the values of uplift and subsidence records (Land Survey Department 1930 ). These existing fault models are understood as a primary mechanism of this earthquake and tsunami (e.g., Namegaya et al. 2011 ), whereas Nakadai et al. ( 2023 ) showed that the agreement with the tsunami records is limited to a narrow area in Tokyo Bay and the east coast of the Izu Peninsula. However, there has been no detailed discussion based on the quantitative tsunami elevation distributions and their initial sea-level motion over the coastal area in Sagami Bay, and thus, their validity has remained unclear. The Central Disaster Management Council, Cabinet Office, Government of Japan ( 2013 ) has proposed a “Tsunami Fault Model” with corrected slip parameters for subdivided fault areas for this earthquake in order to prepare for a megathrust earthquake tsunami in the future. However, there are many places where tsunami fault model simulations are not consistent with the tsunami records (Cabinet Office, Japan 2013 ). These discrepancies between the existing models and the observed tsunami records will be quantified and elucidated in this study.
The greatest mystery in understanding the fault dynamics of the 1923 Great Kanto earthquake stems from the large-scale changes in water depth observed by weight measurement based on the sea depth coordinates of the triangulation survey from Sagami Bay to the mouth of Tokyo Bay after the earthquake (Imperial Japanese Navy 1924 ; Fig. 2 ). Bathymetric surveys were conducted immediately after the earthquake and in January the following year. In Fig. 2 , the blue areas denote deepened water depths and the red areas denote shallowed areas. This map was created based on the Tokyo datum, and the deepening and shallowing depth changes reached as high as 200 m. These survey points were based on land reference points and a triangulation method. Mogi ( 1959 ) analyzed possible errors caused by the measurement method through the creation of a water depth change map similar to that of the Imperial Japanese Navy ( 1924 ) using the survey data by acoustic depth measurement from 1949 to 1955 and the survey records by weight measurements from 1913 (before the earthquake) in Sagami Bay. Although there was an error in the weight measurement method due to the influence of a drifting of the wire due to the tidal current, it was suggested that the deepening distributions could not be ignored and were significant. This study closely examines such seafloor ground dynamics before and after the 1923 Great Kanto earthquake through analysis of the spatial correspondence between the detailed seafloor topography obtained with a current acoustic depth measurement technology and the depth changes following the earthquake.

Depth change map of Sagami Bay before and after the 1923 Great Kanto earthquake, where the deepened areas are highlighted in blue and the shallowed areas in red (Imperial Japanese Navy 1924 )
Landslides and tsunamis are one of the most important cascading multi-geohazards that can cause substantial damage to infrastructures and loss of human life (Locat and Lee 2002 ; Sassa and Sekiguchi 2012 ; Sassa 2023 ; Heidarzadeh et al. 2023 ). Although the origins of the landslides that trigger tsunamis range widely from earthquakes to volcanoes, rainfalls, rising water levels, and among others, the importance of earthquake-induced submarine landslides has recently been emphasized in the 2018 Indonesia Sulawesi earthquake and tsunami disasters, where the cascading strong strike-slip fault earthquake, liquefaction, coastal and submarine landslides, and multiple tsunamis caused more than 2000 fatalities (Sassa and Takagawa 2019 ). In Sagami Bay as the origin of the 1923 Great Kanto earthquake, Ogawa ( 1924 ) was the first to point out the possibility that a submarine landslide caused a large-scale subsidence and uplift of the submarine topography in Sagami Bay. He showed a similarity to the cases at Lake Zurich (1875) and Lake Zug (1435, 1887, 1894) in Switzerland, suggesting that submarine landslides might have caused an increase in tsunamis, with the associated discussion by Terada ( 1924 ). Subsequently, several researchers reported submarine landslides in Sagami Bay (Ohkouchi 1990 ; Kusunoki et al. 1991 ; Watanabe 1993 ; Kato et al. 1993 ; Kasaya et al. 2006 ). The Imperial Japanese Navy ( 1924 ) reported a submarine cable–cutting accident caused by a submarine landslide. However, no in-depth quantitative analysis of the bathymetric changes before and after the 1923 Great Kanto earthquake has been made in the past.
Our preliminarily investigations of the seafloor ground deformations of the 1923 Great Kanto earthquake and associated tsunamis were published in Murata et al. ( 2020 , 2021 ) and Ebisuzaki ( 2021 ). Specifically, Murata et al. ( 2020 , 2021 ) proposed and evaluated the digitizing method for water depth records observed by the weight measurement. Ebisuzaki ( 2021 ) analyzed that the dominant mechanism of “tsunami earthquakes” is large-scale liquefaction and submarine landslides induced by seismic motion based on the historical tsunami earthquake events including the 1923 Great Kanto earthquake. However, this paper presents and discusses four innovations, namely:
Elucidating the gap between the observed tsunami data and the previous simulations from various sources available in the literature.
Presenting the in-depth analysis of the bathymetric changes before and after the Great Kanto earthquake and uncovering the occurrence of submarine landslides in light of the state-of-the-art understanding of the liquefied gravity flow.
Conducting the tsunami simulations based on an optimum fault model and a submarine landslide model due to a high-density liquefied gravity flow.
Quantitatively accounting for the gap and explaining the maximum tsunami elevation distributions, arrival times, and the time-series tsunami waveforms.
Temporal characteristics of the 1923 Great Kanto earthquake tsunami are indeed noteworthy. With reference to Fig. 1 , the arrival time of the tsunami as backwash at Atami and Manazuru on the eastern coast of the Izu Peninsula was 5 to 6 min after the earthquake (Imperial Japanese Navy 1924 ). Then, leading waves came from the northeast direction. The tsunami reached Aihama and Tateyama in the southern part of the Boso Peninsula, the ebb and flood tides were repeated within about 15 min after the earthquake, with the first wave coming from the northwest (Ikeda 1925 ). The local tsunami arrival times and incident directions were significantly different on each coast that divided Sagami Bay into east and west. Such temporal behavior of tsunamis indicates that short-frequency components are dominant and have strong directivity occurring in a local area, showing characteristics common to submarine landslide–induced tsunamis (e.g., Tappin et al. 2014 ; Sassa and Takagawa 2019 ).
The organization of this paper is as follows. We first present an overview of the rupture process of the 1923 Great Kanto earthquake fault models and tsunami predictive accuracy of each model. Next, based on statistical analysis of the depth changes and comparison with the current seafloor topography, we clarify the bathymetric changes and associated seafloor ground dynamics before and after the earthquake. Third, a submarine landslide model will be presented through the identification of a submarine landslide source by tsunami backpropagation analysis and utilizing a theoretical relationship between size, velocity, and slope angle of a high-density gravity flow based on the present understanding of the characteristics of large-scale submarine liquefied sediment flows. The numerical simulations and parameterization of the 1923 Great Kanto earthquake tsunamis will then be presented using a fault model and a submarine landslide tsunami source model due to a high-density liquefied gravity flow. Here, the submarine landslide tsunami source scheme proposed by Watts et al. ( 2005 ) and the numerical tsunami simulator developed at the Port and Airport Research Institute (STOC-ML, Tomita et al. 2006 ) were used. The comparison between the simulated results and the observed overall maximum tsunami elevation distributions along the coasts of Sagami Bay, Tokyo Bay, and the Pacific Ocean, their arrival times, and the available time-series tsunami waveforms in Yokosuka (Aida 1970 ) will be discussed in detail, showing submarine landslides as a major source of the 1923 Great Kanto earthquake tsunamis.
Existing research and tsunami prediction accuracy of each model
Overview of the rupture process of the 1923 great kanto earthquake fault model.
In Fig. 1 , the source fault areas proposed by each existing model generally spread from the western part of the Kanagawa region to the sea beyond the Boso Peninsula (WNW-ESE) and are distributed on a surface dipped to the NNE direction. The slip direction was sideslip at the bottom of the fault. However, a reverse dip-slip fault along the dip occurred near the top of the fault, and asperities were distributed around the epicenter in western Kanagawa and the southern Miura Peninsula (Wald and Somerville 1995 ; Kobayashi and Koketsu 2005 ). Takemura and Ikeura ( 1994 ) argued that the rupture started near the Odawara region in western Kanagawa and transitioned to near the Miura Peninsula (Fig. 1 ) based on short-period data obtained from seismograms. Matsu'ura et al. ( 1980 ) and Nyst et al. ( 2006 ) proposed a segmented fault surface considering slip directional characteristics. In any case, the rupture process of each existing model starts at a depth of approximately 15 km near the Odawara in the western Kanagawa region. The rupture area extends over a region of 130 km in length and 70 km in width in the eastern coastal area of the Boso Peninsula. In addition, each fault model explains the horizontal and vertical movements in the land displacement records before and after the earthquake (e.g., Namegaya et al. 2011 ; Nakadai et al. 2023 ).
Tsunami predictive accuracy
Existing fault models have been evaluated using land deformation records; however, their consistency with the observed tsunami records is limited (Nakadai et al. 2023 ). Here, we present a set of numerical simulations of the 1923 Kanto earthquake tsunami using existing fault models, compare them with the records from various coastal points, and discuss their predictive accuracy.
The numerical tsunami simulator developed at Port and Airport Research Institute (STOC-ML, Tomita et al. 2006 ) was used. The governing equations of the STOC-ML are the continuity equation and the Reynolds-averaged Navier–Stokes equations as the momentum equations. STOC-ML is a quasi-three-dimensional model with the water area divided vertically into multi-levels where the hydrostatic pressure is computed and applied at each level on a general shallow water equation. The simulation time was equal to 180 min and the simulation time step was set to be 0.1 s. The numerical simulation domain was horizontally divided into a uniform mesh grid of 270 m based on the rectangular coordinate system (Fig. 3 a).

a Coastal point map showing the area of analysis in this study (No. 1 to No. 53). b Observed and calculated maximum tsunami elevations at each coastal point (No. 1 to No. 53). Here, black circles denote the observed records and each color line denotes the calculated results from each fault model (F1 to F9) shown in Table 1 . c Observed and calculated time-history waveforms, where the black solid line denotes the observed records and each color line denotes the calculated results by each fault model at Yokosuka tide gauge (No. 30). The tsunami amplitudes are extracted and digitized from the tide records shown in Aida ( 1970 ). d Residual sum of squares RSS results for each fault model at Yokosuka (No. 30)
Table 1 shows each fault model used for the numerical simulation. We selected a total of eight fault models (F1 to F8) and included a tsunami fault model (F9) of the Cabinet Office, Japan ( 2013 ). The tsunami fault model considers tsunami data from several coastal locations and the amount of ground movement on land. The topographic data used for the tsunami propagation simulation was from the Cabinet Office, Japan ( 2013 ), and not the coastal topography 100 years ago. The reason is that there has been essentially no or little change in the coastal topography due to port development in a coastal area of Sagami Bay and Yokosuka that we focus on here. For the purpose of comparison, tsunami waveforms are extracted from the tide records (Aida 1970 ). In the present analysis, since the tsunami records, except for the Yokosuka record, represent the trace heights above sea level observed near the coast, we treated each record as the water surface elevation of tsunami observed at the shoreline. The record of maximum tsunami elevation on each coast has local variations within each observation point area. Here, the sea area in front of each coast is defined as the tsunami elevation time series analysis domain, where the 50th, 25th, and 75th percentiles of the waveforms obtained from multiple coordinates in 9 neighboring cells are evaluated. The maximum tsunami elevation at each coastal point was calculated by using the 50th-percentile time-history waveform obtained from the multiple coordinates in 9 neighboring cells. The above simulation conditions and the numerical treatment were the same for both the fault model–based simulations and the landslide tsunami simulations described later in the “ Numerical simulations of the 1923 Great Kanto earthquake tsunamis using a fault model and a submarine landslide source model ” section. Supplementary material 1 of this paper summarizes the numerical calculation conditions and the detailed parameters of each fault model.
Figure 3 a shows an overview of all the coastal points (No. 1 to No. 53) of this simulation. The tsunami record at each coastal point has been collected from the earthquake disaster survey reports (Imperial Japanese Navy 1924 ; Meteorological Observatory 1924 ; Ikeda 1925 ), field survey results (Hatori et al. 1973 , Hatori 1976 ; Aida 1993 ; Yoshida et al. 2012 ), and tsunami trace database (The International Research Institute of Disaster Science (IRIDeS), Tohoku University, Japan 2010 : https://tsunami-db.irides.tohoku.ac.jp/tsunami/mainframe.php ). Figure 3 b shows the observed and simulated maximum tsunami elevations at each point number (No. 1 to No. 53) shown in Fig. 3 a. Figure 3 c indicates the comparison of the simulated and observed results of the time-history waveforms at Yokosuka (No. 30). In both Fig. 3 b and c, the black solids and lines represent the observed records and the blue solids and lines represent the simulated results from each model (F1 to F9). The time-history waveforms of each model (Fig. 3 c) show 50th-percentile waveforms. The influence of ground deformation on the tsunami data at each coastal point was considered by subtracting the amount of uplift or subsidence obtained from each fault model. Figure 3 d shows the results of the analysis on the residual sum of squares (RSS) in the time-history waveforms in order to evaluate the degree of agreement between the observed record and the simulated results from each model.
The maximum tsunami elevations simulated from each fault model generally explain the records at the coastal points north of the Tokyo Bay mouth (No. 27 to No. 38) as shown in Fig. 3 b. By contrast, the simulated maximum tsunami elevations for the costal points (No. 1 to No. 25 and No. 41 to No. 48) show marked and significant discrepancies with the observed tsunami records, including the southern Miura Peninsula (No. 23), the eastern coast of Sagami Bay (e.g., No. 19) to the eastern coast of the Izu Peninsula (No. 4), and Mera (No. 47) at the southern tip of the Boso Peninsula. These results clearly indicate that each fault model is insufficient to explain the observed tsunami records. Further, the Imperial Japanese Navy ( 1924 ) reported that the initial tsunami undertow then leading waves reached Atami (No. 12) at 5 to 6 min after the earthquake, and the tsunami struck around Yuigahama (No. 18) at 10 to 13 min after the earthquake. However, each fault model cannot reproduce these heights, arrival times, and the initial motions of the tsunami at Atami (No. 12) and Yuigahama (No. 18) (see Supplementary Material 1 of this paper).
It is also evident from the comparison of the time-history waveforms at Yokosuka (No. 30) that the simulated and observed record shows marked discrepancies (Fig. 3 c). Although there exists a limited period, from 0 to 28 min, having a low average RSS-value equal to 5.89, the general RSS shows much higher values in the periods from 28 to 43 min, 43 to 55 min, and 80 to 96 min, with the corresponding average RSS 28–43 = 19.81, RSS 43–55 = 20.05, RSS 80–96 = 33.97, respectively, giving rise to the overall average RSS-value as high as 91.28 (Fig. 3 d). This means that each fault model is incapable of accounting for the observed tsunami time-history waveforms in Yokosuka.
Overall, the above results clearly demonstrate that the observed tsunami records cannot be explained solely by the fault models. Hence, the in-depth analysis of the seafloor bathymetric changes, associated ground dynamics, and their contributions to the 1923 Great Kanto earthquake tsunamis will be presented and discussed hereafter.
Depth changes of the seafloor and associated submarine landslide characteristics before and after the 1923 Great Kanto earthquake
The number of the survey points recorded using the weight measurement method before and after the earthquake is limited and sparse compared to current sounding data. Therefore, the accuracy of the depth changes may not be guaranteed even with spatial interpolation. Here, we utilize the current terrain information on the same coordinate points and analyze the statistical deviations for each group area. Specifically, we analyze the survey errors of the depth changes and the seafloor ground dynamics on the basis of the probability density distributions. Each difference between the weight measurements before and after the earthquake and the current echo-sounding data is the explanatory variables. The ground slope angle grid is a dependent variable. Statistical analysis was performed on each coordinate point using attributes as covariates.
Extraction and digitalization of the coordinate points were evaluated by comparing the current coastal topography based on the map information of the measurement point and the coastline. In Fig. 4 a, the depth change records are divided into four groups (A, B1, B2, C) based on the current topography and geological features. The total number of records of the water depth change was 359, among which Group A with 110 records had the most significant number of valid survey data. Depth change areas are often distributed in the deep-sea area with a more than 1000-m depth that runs north–south along Sagami Bay. Supplementary Material 2 of this paper describes and summarizes the grouping details (A to C) shown in Fig. 4 a, the method of extracting and digitizing each survey point using a geographic information system, and the interpolation results by an inverse distance weighting method using the water depth data of each survey point.

a Grouping results based on the current topography and geological features of the depth changes (Imperial Japanese Navy 1924 ). b Probability density distributions of the depth changes before and after the 1923 Great Kanto earthquake. The left and right figures show the results of analysis for Group A and Group B-1, respectively. Each ground angle shown in Fig. 4 denotes the angle of a slope in degrees with a horizontal plane for a unit length equal to 90 m. The upper and lower figures represent the water depth differences between the current seafloor topography and the before and after earthquake, respectively
Figure 4 b shows representative results of the probability density distributions of Group A and Group B-1. Other group results are summarized in Supplementary Material 2 . The horizontal axis shows the water depth difference between the current topography and the topography before/after the earthquake at each ground angle. d h = 0.0, + , − , mean no depth change, shallowing, and deepening on the seafloor, respectively. Here, the ground angle denotes the angle of a slope in degrees with a horizontal plane for a unit length equal to 90 m. The distributions show dispersion when the effects of deepening and shallowing coexist at a same ground angle. Comparing the water depth difference between the post-earthquake and the present topography shown in the lower panel of Fig. 4 b indicates that d h is dominantly equal to 0 in Group A and B-1, meaning that the water depth has not significantly changed since the earthquake. In contrast, comparing the water depth difference between the pre-earthquake and the present topography shown in the upper panel of Fig. 4 b shows that d h becomes negative in Group A and positive in Group B-1. The former indicates that the sediments outflowed, and the latter indicates that the sediments deposited. The highest-probability depth changes and the associated dominant sediment outflows are observed at a gentle slope with 0 to 5° in Group A. Group A also shows a trend of deepening at some steeper degrees. The corresponding outflow areas extend over a wide area as shown in Fig. 4 a. Group B-1 shows depositional tendency at essentially all ranges of slopes.
The results of collations showing the outflow and deposition are summarized in Fig. 5 a. Here, the blue points show deepening areas (outflow) and the red points show shallowing areas (deposition). The blue dotted line denotes a submarine cable with its cutting positions marked, which are located at the vicinity of the sediment outflow areas. The representative cross-sectional seafloor ground dynamics derived from the water depth change profiles before and after the earthquake along Lines 1, 2, and 3 in Fig. 5 a are shown in Fig. 5 b. The concrete procedure for the interpolation of the seafloor topography before and after the earthquake is summarized in Supplementary Material 2 . Figure 5 a confirms that the deepening outflow areas generally correspond to the submarine canyons in the Sagami Trough, and the shallowing depositional areas are distributed along the cliffs, seafloor slopes, and a submarine canyon. In Fig. 5 b, Line 1 shows an overall sediment outflow over the entire area with the flow thickness up to 142.7 m, Line 2 shows a general depositional tendency, and Line 3 shows the trend of outflow and deposition alternately. The outflow areas along Line 1 have gently sloping grounds with 0.33 \(^\circ\) from 25 to 35 km and 0.37 \(^\circ\) from 45 to 55 km. This means that the dominant sediment outflows and the landslides took place over a very gentle slope. The bathymetric changes and the associated submarine landslide characteristics shown in Figs. 5 and 6 indicate the widespread long-distance run-out, sharing an important feature of the submarine liquefied sediment flows. Namely, the seafloor gradient in the dominant flow area from 20 to 60 km was equal to or less than 0.4 \(^\circ\) as described above. A liquefied gravity flow can develop over a very mild slope with less than 1 \(^\circ\) (Field et al. 1982 ; Sassa and Takagawa 2019 ), which are consistent with the present observations. The dynamics of such submarine liquefied sediment flows features a phase change process in which the transitory fluid-like particulate sediment reestablishes a grain-supported framework accompanying pore fluid migration during the course of flowage (Sassa and Sekiguchi 2010 , 2012 ). However, the transient high-density liquefied flow has been shown to be characterized by a high-density fluid whose density is equivalent with that of liquefied soil, with the associated theoretical framework showing consistent predictions and agreement with the observed flow behavior from laboratory to field (Sassa and Sekiguchi 2010 , 2012 ). This relevant feature of the liquefied gravity flow will be referred to in the “ Submarine landslide source model for the 1923 Great Kanto earthquake tsunamis ” section.

Results of analysis of the seafloor ground dynamics in Sagami Bay before and after the 1923 Great Kanto earthquake. a Results of collations with the detailed topographic map showing the areas of the sediment outflows and depositions, b cross-sectional seafloor ground dynamics derived from the water depth change profiles before and after the earthquake along Lines 1, 2, and 3 in a

a Results of tsunami backpropagation analysis using the tsunami records of Atami (No. 12) and Yokosuka (No. 30). b Detailed seafloor topography at/around the extracted tsunami source (ETS) area as a result of the backpropagation analysis and its relationship with the previously reported traces of submarine landslides (Hydrographic and Oceanographic Department; Japan Coast Guard: JCG 2000 ; Watanabe 1993 ). c A-A’ cross-section of Manazuru Knoll slope
In Fig. 5 b, Line 2 shows a shallowing depositional trend in steep seafloor slopes with 30 \(^\circ\) or more. A detailed examination of the slope angle near the survey point using the results shown in Fig. 5 a indicates that the deposition was over a gentle slope just below the steep slope. In other words, the shallowing depositional tendency of Line 2 in Group B-1 is considered to be a phenomenon where the sediment flowed down from the top of the slope and deposited at the foot of the cliff. Line 3 is located along the submarine canyon at the mouth of Tokyo Bay, where the seafloor ground outflowed and deposited repeatedly. Furthermore, the submarine cables were broken at six locations in the area near Line 3 as shown in Fig. 5 a (marked with x, Imperial Japanese Navy 1924 ). This strongly suggests that the large-scale sediment transport phenomenon of the liquefied ground caused the cable to break.
Submarine landslide source model for the 1923 Great Kanto earthquake tsunamis
Identification of a submarine landslide source by tsunami backpropagation analysis.
Imperial Japanese Navy ( 1924 ) reported that the initial tsunami undertow then leading waves reached Atami (No. 12) or Manazuru (No. 13) 5 to 6 min after the earthquake, and the tsunami struck around Yuigahama (No. 18) 10 to 13 min after the earthquake. However, each fault model shown in the “ Existing research and tsunami prediction accuracy of each model ” section above cannot explain the arrival times and initial undertow of the tsunami at Atami (No. 12) and Yuigahama (No. 18) (Supplementary Material 1 ). Table 2 shows relevant information on the tsunami arrival times for each coastal point, where Atami (No. 12) and Manazuru (No. 13) located in the western part of Sagami Bay show relatively early tsunami initial movements (Imperial Japanese Navy 1924 ; Meteorological Observatory 1924 ; Ikeda 1925 ). Here, a range of tsunami backpropagation analysis was performed based on the assumption that the propagation times required for the distances between the tsunami source locations and observation stations are equivalent irrespective of the directions. This analysis was conducted by considering hypothetical tsunami sources at the location of a tsunami observation point and drawing the tsunami travel time contours propagating backwards from that observation point to the open sea. Then, the area where all reverse travel time contours from all points met was extracted as the source of the tsunami. The backpropagation analysis is a powerful tool for pinpointing the location of tsunami source (e.g., Hayashi et al. 2011 ; Heidarzadeh et al. 2023 ). The results of this analysis for Atami (No. 12) and Yokosuka (No. 30) are shown in Fig. 6 a. This figure also shows the propagation diagram using the tsunami arrival information at Atami (No. 12) and Yokosuka (No. 30). The blue lines indicate the tsunami backpropagation diagram extracted from Atami (No. 12) and Yokosuka (No. 30) (Atami diagram line = 5 min, Yokosuka diagram line = 29 min). The overlapping area exists in the southeastern region off Cape Manazuru (hereafter referred to as ETS, extracted tsunami source). In other words, ETS highlights a secondary tsunami source area that cannot be explained by the existing fault models as described above. Furthermore, the ETS corresponds to the area where the seafloor sediments extensively outflowed showing large-scale submarine landslides, as shown in Fig. 5 a.
Figure 6 b shows the visualization result of the detailed seafloor topography at/around the extracted tsunami source (ETS) just mentioned. The double circles indicate the deepening outflow area (blue) and the shallowing deposition area (red) as shown in Fig. 5 a and the area with no essential change (white, Imperial Japanese Navy 1924 ). The yellow- and green-shaded areas represent the locations showing the traces of submarine landslides reported previously (Hydrographic and Oceanographic Department; Japan Coast Guard: JCG 2000 ; Watanabe 1993 ). In Fig. 6 b, the Sagami Trough crosses the Sagami Bay from north to south. The Manazuru Knoll and the Sagami Knoll are distributed along the submarine canyon from Atami Bay, which is located at the northwestern end of the Sagami Trough. The ETS strongly suggests that the submarine landslide tsunami occurred in this area. A close examination of Fig. 6 a and b shows that the submarine landslide source area marked by the orange-shaded zone in Fig. 6 b is smaller in size than the ETS area in Fig. 6 a. The reasoning for this limited submarine landslide source stemmed from the fact that the left-side area of the ETS corresponded to the area with no essential change characterized by the white circles, indicating that this area cannot be regarded as a landslide source, and that a steeper slope and a shallower water depth generally exhibit a more significant effect on tsunami generation (Grili and Watts 2005 ; Watts et al. 2005 ). Figure 6 c shows the ETS cross-sectional (A-A’) geometry with the average slope angle equal to \(\theta =\) 8.45 \(^\circ\) .
Overall, based on the ETS area evaluated by the tsunami backpropagation analysis, overlapping with the results of the present seafloor ground dynamics analysis as well as the previously reported traces of submarine landslides, and detailed bathymetric survey data, the submarine landslide source in Sagami Bay for the 1923 Great Kanto earthquake tsunami has been identified as the orange-shaded area in Fig. 6 b as described above. The submarine landslide source shows that submarine landslides occurred just above the Manazuru Knoll, located in the western part of Sagami Bay, as part of the widespread submarine liquefied sediment flows described above, which were induced by the strong seismic motion of the 1923 Great Kanto earthquake. Furthermore, the literature on many carcasses of deep-sea fish after the earthquake in the sea area off the east coast of the Izu Peninsula (Imperial Japanese Navy 1924 ) reinforces the start of the large-scale submarine landslides originating from the southern slope of the Manazuru Knoll in Sagami Bay. According to Kato et al. ( 1987 ), the turbidite layer supplied from the Sagami Bay seafloor is thickly deposited on the Katsuura Basin located off the southern coast of the Boso Peninsula.
Analytical solution on the terminal velocity of a high-density liquefied gravity flow on a southern slope of Manazuru Knoll
The submarine landslide characteristics as presented in the “ Depth changes of the seafloor and associated submarine landslide characteristics before and after the 1923 Great Kanto earthquake ” section indicate an important feature of the submarine liquefied gravity flows which can be characterized by a high-density fluid whose density is equivalent with that of liquefied soil. On this basis, we adopt here a theorical solution of a gravity flow. By employing the analytical solution by Ross ( 2000 ) and considering the mass density of a liquefied soil (Sassa et al. 2001 ), the terminal velocity of a liquefied gravity flow is given by:
where ρ is the mass density of a liquefied soil , ρ 0 is the mass density of the ambient fluid, u f is the terminal velocity of a liquefied gravity flow on a submarine slope (m/s), F r is the Froude number, g is the gravitational acceleration (m/s 2 ), V is the volume of the gravity flow, and \(\theta\) is the seabed ground angle ( \(^\circ\) ). Here, the gravity-flow volume consists of submarine landslide length l (m) and thickness h (m) per a unit width of a submarine landslide.
The scale of the submarine landslide, the orange shaded area in the ETS on the southern slope of the Manazuru Knoll, can be estimated as length l = 3 km and width w = 5 km from the detailed topographical interpretation in Fig. 6 b. The thickness h of the submarine landslide was set equal to 140 m which essentially corresponded to that of the large-scale submarine liquefied sediment flows as shown in Fig. 5 b. The seafloor ground angle was set to be \(\theta\) = 8.45 \(^\circ\) from Fig. 6 c. Table 3 shows the parameterized submarine landslide scale on the southern slope of the Manazuru Knoll. The specific gravity of the submarine landslide was set equal to 1.85 of a liquefied gravity flow, namely with the mass density of a liquified soil (Sassa et al. 2001 ; Sassa and Sekiguchi 2012 ). Here, the specific gravity represents the ratio of the mass density of a liquefied soil to that of the ambient fluid. Figure 7 shows the relationship between the gravity-flow volume (horizontal axis) and the terminal velocity u f (vertical axis) corresponding to the high-density liquefied gravity flow based on Eqs. ( 1 ) and ( 2 ) and Table 3 . Here, the ground angles determine the terminal velocities for a given flow volume, and the red line shows the terminal velocity on the southern slope of the Manazuru Knoll. For the purpose of comparison, the blue line shows the terminal velocity for the average slope angle equal to 0.6 \(^\circ\) in the entire Sagami Bay. Considering the scale of the gravity flow as represented by l × h /2 = 3000 × 140/2 = 210,000 m 2 as schematically shown in Fig. 7 , the terminal velocity for the liquefied gravity flow on the southern slope of the Manazuru Knoll becomes equal to 32.2 m/s. This value will be referred to in the “ Numerical simulations of the 1923 Great Kanto earthquake tsunamis using a fault model and a submarine landslide source model ” section.

Terminal velocity versus volume of a high-density liquefied gravity flow on the southern slope of Manazuru Knoll as determined by the analytical solution that takes account of the mass density of a liquefied soil
Numerical simulations of the 1923 Great Kanto earthquake tsunamis using a fault model and a submarine landslide source model
Methods for the submarine landslide tsunami simulations.
On the basis of the results presented in the “ Existing research and tsunami prediction accuracy of each model ,” “ Depth changes of the seafloor and associated submarine landslide characteristics before and after the 1923 Great Kanto earthquake ,” and “ Submarine landslide source model for the 1923 Great Kanto earthquake tsunamis ” sections, the “ Numerical simulations of the 1923 Great Kanto earthquake tsunamis using a fault model and a submarine landslide source model ” section presents a series of the numerical simulations of the 1923 Great Kanto earthquake tsunamis using a fault model and a submarine landslide tsunami source model. Here, the dimensions of the submarine landslide source correspond to those of a high-density liquefied gravity flow as described above. The simulated results will be compared and discussed in light of a range of coastal tsunami records. The submarine landslide tsunami source scheme adopted a slump model based on empirical formulas developed by Grilli and Watts ( 2005 ) and Watts et al. ( 2005 ). This scheme, via their shape parameters, can evaluate the influence of landslide flow on the shape of the initial tsunami wave form approximated by a simultaneous dipole Gaussian. Accordingly, the present analysis addressed a parametrization of a shape parameter to examine the influence of the landslide flow characterized by the high-density liquefied gravity flow on the tsunami generation in the Sagami Trough, corresponding to Case 1 to 5 in Table 4 . The validity of the initial water-level fluctuation amplitude from a landslide tsunami has been shown by Watts et al. ( 2005 ) and Grilli and Watts ( 2005 ) based on the hydraulic and numerical experiments using a fully nonlinear potential flow model (FNPF), and also by several studies on past submarine landslide tsunami events (e.g., Tappin et al. 2008 , 2014 ). As described in the “ Tsunami predictive accuracy ” section, the tsunami simulation program and its numerical conditions were the same as used for the fault-model–based simulations, and the 50th, 25th, and 75th percentiles of the waveforms were obtained from multiple coordinates in 9 neighboring cells at each coastal point (see the “ Overview of the rupture process of the 1923 Great Kanto earthquake fault model ” section and Supplementary Material 1 for details). As for the fault model, the fault model F8 by Namegaya et al. ( 2011 ) was used as an optimal fault model, which showed the lowest overall RSS-value among the eight fault models (F1 to F8) and the tsunami fault model (F9) shown in Fig. 3 d.
Table 4 shows the dimensions of the submarine landslides and parameters and coefficients set in the analysis. The hydrodynamic coefficients were set equal to those used in Watts et al. ( 2005 ). The water depth at the submarine landslide source before the earthquake, h = 740 m, was derived from the detailed seafloor topography in Fig. 6 b, by considering the flow thickness equal to 140 m as described above. The submarine landslide took place on the southern slope of the Manazuru Knoll and flowed down through the Sagami Trough. With reference to Fig. 6 a, the flow direction was set at 75 \(^\circ\) with the north–south direction as a primary axis. The associated sensitivity analysis on the flow direction is described in Supplementary Material 3 . The flow section on the southern slope of the Manazuru Knoll was set to be 3300 m long. This was based on the topographic interpretation, and considering the possible most significant section that could have affected the tsunami excitation, and importantly, taking account of the consistency with the liquefied gravity flow. Namely, the corresponding terminal velocity calculated by the source model of Watts et al. ( 2005 ) was equal to 31.48 m/s, which essentially corresponded to the terminal velocity of a high-density liquefied gravity flow on the southern slope of the Manazuru Knoll as shown in Fig. 7 . The liquefied gravity flow is assumed here to have reached its terminal velocity immediately following the occurrence of the 1923 Great Kanto earthquake.
Results and discussion
Figure 8 a indicates the simulated and observed maximum tsunami elevations at each coastal point shown in Fig. 3 a. Here, the solid circles represent the observed records, the simulated results by an optimal fault model are marked with F8, and the simulated results by the fault model and the submarine landslide source models are denoted by Cases 1 to 5, respectively. Figure 8 b shows the simulated and observed tsunami time-history waveforms in Yokosuka (No. 30). Here, the simulated results denote the 50th-percentile (median) waveforms, where the solid line represents the observed waveforms marked with “Record,” the simulated results by the optimal fault model, and by the fault model, and the submarine landslide source models marked with “FLT + SL” are denoted in the same way as in Fig. 8 a. The difference here is that the simulated results by the submarine landslide source models are denoted by Cases 1’ to 5’ marked with “SL” in Fig. 8 b. The observed records are the same as shown in Fig. 3 b and c.

a Simulated and observed maximum tsunami elevations at each coastal point (No. 1 to No. 53) shown in Fig. 3 a. The black circles denote the observed records, F8 denotes the simulated results by an optimal fault model with the lowest RSS values shown in Fig. 3 d, and Cases 1 to 5 denote the simulated results by the fault model and the submarine landslide source models shown in Table 4 . b Comparison of the simulated and observed time-history waveforms in Yokosuka (No. 30). The black solid line denotes the observed records, the F8 and Cases 1 to 5 marked with “FLT + SL” denote the same as in a . Cases 1’ to 5’ denote the simulated results by the submarine landslide source models without the fault model, marked with “SL.” All of the simulated results in a and b denote those from the 50th-percentile (median) waveforms at each coastal point
In Fig. 8 a, it is clear that the simulated maximum tsunami elevations obtained by the optimal fault model (F8) disagree substantially with the observed tsunami records except for the regions at north of the Tokyo Bay mouth (No. 27 to No. 38) with the lowest observed maximum tsunami elevations up to 2 m. In contrast, the simulated results by the optimal fault model and all the submarine landslide source models (Cases 1 to 5) improve the predictions significantly by amplifying the tsunami components, including the areas of Atami (No. 12), Oiso (No. 15), Yuigahama (No. 18), around the southern tip of Boso in Sunosaki (No. 43), and Mera (No. 47). Indeed, in Atami (No. 12) with the highest observed maximum tsunami elevations, the simulated maximum values of the 50th-percentile waveforms give rise to an increasing tendency, in comparison to 1.6 m by the optimal fault model (F8), from 4.46 m in Case 1 to 10.35 m in Case 5, where the latter shows a general agreement with the observed maximum tsunami elevation of about 12 m in Atami (No. 12).
At around the Tokyo Bay mouth (Uraga, No. 27, to Kanaya, No. 38), the simulated results are essentially the same with and without the submarine landslide sources. The wavelength of the tsunami induced by a submarine landslide is known to be typically shorter than that of the tsunami induced by a fault motion (Brink et al. 2014 ). Accordingly, a shorter-period component may be dominant in the former compared with a longer-period component in the latter and can thus more significantly attenuate through reflection and refraction over the coastal topography, which may be consistent with the observed small tsunami elevation especially on the north of Cape Futtsu (No. 36).
A comparison of the time-history waveforms (Fig. 8 b) in Yokosuka (No. 30), located in the south of Cape Futtsu, indicates that the submarine landslide–induced tsunami propagated from the leading wave component (SL, Cases 1’ to 5’). This may correspond to the thrust wave component of the SL tsunami generated offshore by the submarine landslide on the southern slope of the Manazuru Knoll. This tsunami generation process is consistent with the characteristics of the SL tsunami, in which the first wave is dominant as a forward wave component in the flow direction of the landslide (e.g., Haugen et al. 2005 ). Moreover, it accounts well for the start of the significant gap between the fault model prediction and the tsunami record at t = 28–30 min. Indeed, the fault model (F8) results are distributed in antiphase to the observed waveform at 28–42 min, 43–55 min, and 80–96 min. However, the present models (FLT + SL) show consistent phases with the observed record. Consequently, the submarine landslide components improve the time-history predictions considerably with increasing SL tsunami components from Case 1 to 5 (FLT + SL).
On the basis of the results and comparisons presented above, a summary of the results of the present simulations adopting the optimal fault model (F8) and a suitable submarine slide source model (Case 5) is shown in Fig. 9 . For the purpose of a closer examination, all the results are shown here in terms of the 25th-, 50th-, and 75th-percentile variabilities.

a Simulated and observed maximum tsunami elevations at each coastal point (No. 1 to No. 53). The black circles denote the observed records, F8 denotes the simulated results by an optimal fault model shown in Fig. 8 a, and Case 5 denotes the simulated results with the 50th-, 25th-, and 75th-percentile variabilities. b Comparison of the simulated and observed time-history waveforms in Yokosuka (No. 30). The black solid line denotes the observed records. FLT and SL + FLT denote the simulated results by F8 and Case 5, respectively. c Comparison of the observed tsunami records and the simulated time-history waveforms with each percentile in Yuigahama (No. 18), Atami (No. 12), Oshima (No. 1), Mera (No. 47), Manazuru (No. 13), and Shimoda (No. 2). The light red areas indicate the observed tsunami records with an upper to lower limit at each coastal point. Here, all of the simulated results in time series denote those for the 50th percentile (solid lines), the 25th percentile (lower dotted lines), and the 75th percentile (upper dotted lines)
In Fig. 9 a, the observed maximum tsunami elevations increase from Shimoda (No. 2) to Atami (No. 12) at the southern tip of the Izu Peninsula. These geographically increasing maximum tsunami elevations are well explained by the present simulations considering the 25th- to 75th-percentile variabilities. Moreover, the present simulations well explain the observed local maximum tsunami elevations from Enoshima (No. 17) to Zushi (No. 19) in the area of the eastern coast of Sagami Bay, Koyatsu (No. 42) and Sunosaki (No. 43) to Nojimasaki (No. 48) located in the southern part of the Boso Peninsula facing the Pacific Ocean. Essentially, the present results generally conform well to the observed maximum tsunami elevation distributions along the whole coast.
It is important to note in Fig. 9 a that there are a few or a limited number of coastal points where the simulated results exhibited a certain discrepancy with the observed maximum tsunami elevations, notably Jogashima (No. 24). This could be closely related with another possible submarine landslide source. The basis of this is such that Jogashima is located above the regions where the submarine cable-cutting accidents are previously reported as in Fig. 5 a, and with reference to Fig. 1 , the epicenter of the 1923 Great Kanto earthquake migrated from the first in the western Sagami Bay to the second in the southern Miura Peninsula, the latter of which may have caused this second submarine landslide source in this area, such as the submarine landslides along Line 3 shown in Fig. 5 b. The results shown in Figs. 8 and 9 a also indicate that the shape parameters of Watts et al. ( 2005 ) adopted in Cases 1 to 5 had a significant effect on the tsunami generation. Such parameterization may depend on a number of factors which could involve multiple landslide sources and a more realistic modelling on the multi-phased physics of the submarine landslide processes and their consequence in light of the submarine liquefied flows undergoing flow stratification, deceleration, and redeposition (Sassa and Sekiguchi 2010 , 2012 ).
Figure 9 b shows the simulated and observed time-history waveforms at Yokosuka (No. 30). It is seen that the present results (FLT + SL) account well for the observed tsunami time-history waveforms. With reference to the observed tsunami arrival times shown in Table 2 , the simulated time-history waveforms at Yuigahama (No. 18), Mera (No. 47), Atami (No. 12), Manazuru (No. 13), Oshima (No. 1), and Shimoda (No. 2) are summarized in Fig. 9 c. In these graphs, the red shaded areas indicate the observed tsunami records at each location. The tsunami arrival times at 28 to 30 min after the earthquake in Yokosuka (No. 30) in Table 2 agree with the timing when the submarine landslide–induced tsunami arrived, as shown in Figs. 8 and 9 b. At Yuigahama (No. 18), the present results (FLT + SL) show 6.23 m (50th percentile) and 9.33 m (75th percentile) at 11 to 12 min after the earthquake, and at Atami (No. 12), the present results show a tsunami backwash with − 1.3 m (50th percentile) and − 2.8 m (75th percentile) at 4.5 min after the earthquake and a local leading tsunami with 9.83 m (50th percentile) and 13.77 m (75th percentile). These simulated tsunami initial motions with their arrival times as well as the local tsunami elevations accord well with the observed records at each coastal point shown in Table 2 and Fig. 9 c. Furthermore, the observed tsunami records at Manazuru (No. 13), Oshima (No. 1), Mera (No. 47), and Shimoda (No. 2) can be reasonably well explained by the present results (FLT + SL) in terms of the tsunami arrival times and the local tsunami elevations as shown in Fig. 9 c and Table 2 . The optimal fault model (FLT) is incapable of accounting for these tsunami records, in particular, cannot explain as high as 13 m tsunami record at Oshima (No. 1) at all, whereas the present FLT + SL results conform to this distinct tsunami record locally.
The results of the RSS analysis of each model (FLT and FLT + SL) for the Yokosuka record are shown in Table 5 to quantitatively evaluate its consistency with the observed time-history waveforms. It is evident that the present FLT + SL results show substantially lower RSS-values compared with those by the optimal fault model (F8) after the submarine landslide-induced tsunami arrived in Yokosuka at 28 min after the earthquake. This means that the submarine landslide contributed markedly to the time-history waveforms of the observed tsunami.
Overall, the above results demonstrate that the submarine landslides as represented by a high-density liquefied gravity flow played a pivotal role in the observed time-history waveforms, initial tsunami motion (arrival times), and the maximum tsunami elevation distributions along the whole coast in the Izu Peninsula and the Miura Peninsula facing Sagami Bay, the Miura Peninsula and the Boso Peninsula facing Tokyo Bay, and the Boso Peninsula facing the Pacific Ocean for the tsunami damage of the 1923 Great Kanto earthquake.
Conclusions
The present study investigated submarine landslides and tsunamis in Sagami Bay at the 1923 Great Kanto earthquake that caused severe and extensive damages from the east coast of the Izu Peninsula to the west coast of the Boso Peninsula involving the devastating damage in Atami, Japan. The principal findings and conclusions obtained from this study are as follows.
The comprehensive gap between the predictions by the existing nine fault models and the observed tsunamis was quantified by showing that the fault models can explain the observed low tsunami elevation areas at around Tokyo Bay mouth, however, are incapable of accounting for the observed time-history waveforms in Yokosuka, the observed tsunami initial motions with their arrival times at Atami and Yuigahama, and the observed maximum tsunami elevation distributions along the whole coast including the southern Miura Peninsula, the eastern coast of Sagami Bay to the eastern coast of the Izu Peninsula, and the southern tip of the Boso Peninsula. These results clearly indicate that each fault model is insufficient to explain the observed tsunami records.
The results of the in-depth statistical analysis of the water depth density distributions before and after the 1923 Great Kanto earthquake demonstrated that the seafloor bathymetric changes, that took place before and after the earthquake, represented large-scale submarine landslide phenomena. The seafloor gradient in the dominant flow area over a 40 km flow-out distance was equal to or less than 0.4 \(^\circ\) . These bathymetric changes and the associated submarine landslide characteristics indicated the widespread long-distance run-out, sharing an important feature of the submarine liquefied gravity flows that can develop over a very gentle slope with less than 1 \(^\circ\) .
Through the identification of the submarine landslide source by tsunami backpropagation analysis and utilizing an analytical solution of a high-density liquefied gravity flow and a sensitivity analysis, a range of numerical simulations of the 1923 Great Kanto earthquake tsunamis was conducted using an optimal fault model with the lowest residual sum of squares (RSS) values among the nine existing models with the observed time-history waveforms, and the submarine landslide tsunami source models due to a high-density liquefied gravity flow.
The present results demonstrate that the submarine landslides as represented by a high-density liquefied gravity flow played a pivotal role in consistently accounting for the observed time-history waveforms, the observed initial tsunami motions and their arrival times, and the observed maximum tsunami elevation distributions along the whole coastal areas along three peninsulas involving Izu, Miura, and Boso Peninsulas facing Sagami Bay, Tokyo Bay, and the Pacific Ocean, thereby showing submarine landslides as a major source of the 1923 Great Kanto earthquake tsunamis.
Since a better integrated understanding of the landslide dynamics and landslide-water interactions is crucial to reducing landslide tsunami disaster risk globally (Sassa et al. 2022 ), it is hoped that the findings and conclusions obtained in the present study may facilitate and deepen our understanding of the earthquake-induced submarine landslide tsunami risk as cascading multi-geohazards.
Aida I (1970) A numerical experiment for the tsunami accompanying the Kanto earthquake of 1923. Bull Earthq Res Inst Univ Tokyo (in Japanese) 48(1):73–86. https://doi.org/10.15083/0000033340
Article Google Scholar
Aida I (1993) Historical tsunamis and their numerical models which occurred in the north-western part of Sagami Bay. J Geog (in Japanese) 102(4):427–436. https://doi.org/10.5026/jgeography.102.4_427
Ando M (1971) A fault-origin model of the Great Kanto earthquake of 1923 as deduced from geodetic data. Bull Earthq Res Inst Univ Tokyo 49:19–32. https://doi.org/10.15083/0000033258
Ando M (1974) Seismo-tectonics of the 1923 Kanto earthquake. J Phys Earth 22:263–277. https://doi.org/10.4294/jpe1952.22.263
Brink US, Chaytor JD, Geist EL, Brothersa DS, Andrews BD (2014) Assessment of tsunami hazard to the U.S. Atlantic Margin Mar Geol 353:31–54. https://doi.org/10.1016/j.margeo.2014.02.011
Central Disaster Management Council, Cabinet Office, Government of Japan (2013) Study group of Tokyo inland earthquake model. https://www.geospatial.jp/ckan/organization/naikakufu-02 . Accessed 15 Aug 2023
Ebisuzaki T (2021) What is tsunami earthquake? Proc Int Conf Offshore Mech Arct Eng – OMAE: OMAE2021–63104. https://doi.org/10.1115/OMAE2021-63104
Field ME, Gardner JV, Jennings AE, Edwards BD (1982) Earthquake-induced sediment failures on a 0.25° slope, Klamath River delta, California. Geology 10(10): 542–546. https://doi.org/10.1130/0091-7613(1982)10%3C542:ESFOAS%3E2.0.CO;2
Grilli ST, Watts P (2005) Tsunami generation by submarine mass failure. I: modeling, experimental validation, and sensitivity analyses. J Waterw Port, Coast Ocean Eng 131(6):283–297. https://doi.org/10.1061/(ASCE)0733-950X(2005)131:6(283)
Hatori T (1976) Monuments of the 1703 Genroku tsunami along the south Boso Peninsula: wave height the 1703 tsunami and its comparison with the 1923 Kanto tsunami. Bull Earthq Res Inst Univ Tokyo (in Japanese) 51:63–81. https://doi.org/10.15083/0000033225
Hatori T, Aida I, Kajiura K (1973) Tsunamis in the south-Kanto district. Publications for the 50th Anniversary of the Great Kanto Earthquake, 1923 (in Japanese): 57–66
Haugen KB, Løvholt F, Harbitz CB (2005) Fundamental mechanisms for tsunami generation by submarine mass flows in idealized geometrics. Mar Pet Geol 22:209–217. https://doi.org/10.1016/j.marpetgeo.2004.10.016
Hayashi Y, Tsushima H, Hirata K, Kimura K, Maeda K (2011) Tsunami source area of the 2011 off the Pacific coast of Tohoku earthquake determined from tsunami arrival times at offshore observation stations. Earth Planets Space 63:809–813. https://doi.org/10.5047/eps.2011.06.042
Heidarzadeh M, Gusman AR, Mulia IE (2023) The landslide source of the eastern Mediterranean tsunami on 6 February 2023 following the Mw 7.8 Kahramanmaraş (Türkiye) inland earthquake. Geosci Lett 10:50. https://doi.org/10.1186/s40562-023-00304-8
Ikeda T (1925) Investigation report on the tsunami in the direction of Izu-Awa and the Hatsushima Land change. Earthquake Prevention Survey Report (in Japanese) 100(2):97–112
Google Scholar
Imperial Japanese Navy (1924) The chart showing the change of the depth of the sea in Sagami Nada and its vicinity after the Great Kanto earthquake of 1st. September, 1923. The Hydrographic bulletin 3rd year, 16
Ishibashi K (1980) Current tectonics surrounding the Izu Peninsula. Chikyu Monthly (in Japanese) 2:110–119
Ishibashi K (1985) Possibility of large earthquake near Odawara, Central Japan, Preceding the Tokai earthquake. Earthq Predic Res 3:319–344. https://doi.org/10.1007/978-94-017-2738-9_7
Japan Coast Guard (2000) Tectonic landform in Sagami Bay. 4–7 Report of the Coordinating Committee for Earthquake Prediction (in Japanese) 64: 209–215. https://cais.gsi.go.jp/YOCHIREN/report/index64.html
Kanamori H (1971) 2. Faulting of the Great Kanto earthquake of 1923 as revealed by seismological data. Bull Earthq Res Inst Univ Tokyo 49: 13–18. https://doi.org/10.15083/0000033257
Kasaya T, Mitsuzawa K, Goto T, Iwase R, Sayanagi K, Araki E, Asakawa K, Mikada H, Watanabe T, Takahashi I, Nagao T (2006) Trial of multidisciplinary observation at an expandable sub-marine cabled station “off-Hatsushima Island observatory” in Sagami Bay. Japan Sensors 9(11):9241–9254. https://doi.org/10.3390/s91109241
Kato S, Iwabuchi Y, Asada A, Kato Y, Kikuchi S, Kokuta S, Kusunoki K, Watanabe K (1993) Crustal structure and tectonic landform of Sagami Bay. J Geog (in Japanese) 102(4):399–406. https://doi.org/10.5026/jgeography.102.4_399
Kato S, Tomiyasu Y, Doki Y (1987) Multi-channel seismic reflection survey in the Sagami Trough. Report of Hydrographic Researches (in Japanese) 22: 95–111. https://hdl.handle.net/1834/16152
Kobayashi R, Koketsu K (2005) Source process of the 1923 Kanto earthquake inferred from historical geodetic, teleseismic, and strong motion data. Earth Planets Space 57:261–270. https://doi.org/10.1186/BF03352562
Kusunoki K, Kikuchi S, Kokuta S, Fukae K (1991) Tectonic landform surveys in the northwestern area of Sagami Bay. Report of Hydrographic Researches (in Japanese) 27: 113–131. https://hdl.handle.net/1834/16087
Land Survey Department (1930) Map showing the depression and upheaval of the ground produced at Kwanto districts after the great earthquake. Reconstruction Survey Article for the Kanto Earthquake, https://www.gsi.go.jp/kohokocho/hodo/2023/kanto_100/H-hendo_T12.jpg . Accessed 15 Aug 2023
Locat J, Lee HJ (2002) Submarine landslides: advances and challenges. Can Geotech J 39(1):193–212. https://doi.org/10.1139/t01-089
Matsu’ura M, Iwasaki T (1983) Study on coseismic and post seismic crustal movements associated with the 1923 Kanto earthquake. Tectonophysics 97:201–215. https://doi.org/10.1016/0040-1951(83)90148-8
Matsu’ura M, Iwasaki T, Suzuki Y, Sato R, (1980) Statical and dynamical study on faulting mechanism of the 1923 Kanto earthquake. J Phys Earth 28:119–143. https://doi.org/10.4294/jpe1952.28.119
Meteorological observatory (1924) Research Report on the Great Kanto earthquake, chapter of the Earthquake (in Japanese). https://doi.org/10.11501/984966
Mogi A (1959) On the depth change at the time of Kanto earthquake in Sagami Bay. The Hydrographic bulletin (in Japanese) 60: 52–60. https://gbank.gsj.jp/ld/resource/geolis/88809536
Moroi T, Takemura M (2004) Mortality estimation by causes of death due to the 1923 Kanto earthquake. J Japan Association for Earthquake Engineering (in Japanese) 4(4):21–45. https://doi.org/10.5610/jaee.4.4_21
Murata K, Sassa S, Takagawa T (2020) Tsunami disaster caused by the 1923 Great Kanto earthquake and the importance of submarine landslides. Proc 5th World Landslide Forum 280–285
Murata K, Sassa S, Takagawa T, Ebisuzaki T, Maruyama S (2021) Pre- and post-tsunami depth changes of submarine topography for the analysis of submarine landslide-induced tsunami: proposal of digitization method and application to the case of the 1923 Great Kanto earthquake tsunamis. Proc Int Conf Offshore Mech Arct Eng - OMAE: OMAE2021–63096. https://doi.org/10.1115/OMAE2021-63096
Nakadai Y, Tanioka Y, Yamanaka Y, Nakagaki T (2023) Re-estimating a source model for the 1923 Kanto earthquake by joint inversion of tsunami waveforms and coseismic deformation data. Bull Seismol Soc 113(5):1856–1866. https://doi.org/10.1785/0120230050
Namegaya Y, Satake K, Hishikura M (2011) Fault models of the 1703 Genroku and 1923 Taisho Kanto earthquakes inferred from coastal movements in the southern Kanto area. Annual Report on Active Fault and Paleoearthquake (in Japanese) 11:107–120
Nyst M, Nishimura T, Pollitz FF, Thatcher W (2006) The 1923 Kanto earthquake reevaluated using a newly augmented geodetic data set. J Geophys Res Atmos 111:B11306. https://doi.org/10.1029/2005jb003628
Ogawa T (1924) On the significance of the so-called depression and upheaval in Sagami Bay. Chikyu (in Japanese) 1(6): 405–446. https://hdl.handle.net/2433/182679
Ohkouchi N (1990) Active geological structures and tectonics in Sagami Bay area. J Geog (in Japanese) 99(5):458–470. https://doi.org/10.5026/jgeography.99.458
Ross AN (2000) Gravity currents on slopes. A dissertation submitted for the degree of Doctor of Philosophy in the University of Cambridge
Sassa S (2023) Landslides and Tsunamis: Multi-Geohazards. Landslides 20(7):1335–1341. https://doi.org/10.1007/s10346-023-02084-w
Sassa S, Sekiguchi H (2010) LIQSEDFLOW: Role of two-phase physics in subaqueous sediment gravity flows. Soils Found 50(4):495–504. https://doi.org/10.3208/sandf.50.495
Sassa S, Sekiguchi H (2012) Dynamics of submarine liquefied sediment flows: theory, experiments and analysis of field behavior. Adv Nat Technol Hazards Res 31:405–416. https://doi.org/10.1007/978-94-007-2162-3_36
Sassa S, Takagawa T (2019) Liquefied gravity flow-induced tsunami: first evidence and comparison from the 2018 Indonesia Sulawesi earthquake and tsunami disasters. Landslides 16(1):195–200. https://doi.org/10.1007/s10346-018-1114-x
Sassa S, Sekiguchi H, Miyamoto J (2001) Analysis of progressive liquefaction as a moving-boundary problem. Géotechnique 51(10):847–857. https://doi.org/10.1680/geot.2001.51.10.847
Sassa S, Grilli ST, Tappin DR, Sassa K, Karnawati D, Gusiakov VK, Løvholt F (2022) Understanding and reducing the disaster risk of landslide-induced tsunamis: a short summary of the panel discussion in the World Tsunami Awareness Day Special Event of the Fifth World Landslide Forum. Landslides 19(2):533–535. https://doi.org/10.1007/s10346-021-01819-x
Takemura M, Ikeura T (1994) Source characteristics of the 1923 Kanto earthquake as deduced from data in short-period range, interpretation of personal experiences and a short-period seismogram. Zisin (J Seismological Society Japan. 2nd ser.) (in Japanese) 47:351–364. https://doi.org/10.4294/zisin1948.47.4_351
Tappin DR, Grilli ST, Harris JC, Geller RJ, Masterlark T, Kirby JT, Shi F, Ma G, Thingbaijam KKS, Mai PM (2014) Did a submarine landslide contribute to the 2011 Tohoku tsunami? Mar Geol 357(1):344–361. https://doi.org/10.1016/j.margeo.2014.09.043
Tappin DR, Watts P, Grilli ST (2008) The Papua New Guinea tsunami of 17 July 1998: anatomy of a catastrophic event. Nat Hazards Earth Sys Sci 8(2):243–266. https://doi.org/10.5194/nhess-8-243-2008
Terada T (1924) On the earthquake in 1st September Taisho 12nd. J Geog (in Japanese) 36(7):395–410. https://doi.org/10.5026/jgeography.36.7_395
Tomita T, Honda K, Kakinuma T (2006) Application of three-dimensional tsunami simulator to estimation of tsunami behavior around structures. Proc 30th Int Conf on Coast Eng, ASCE: 1677–1688. https://doi.org/10.1142/9789812709554_0142
The International Research Institute of Disaster Science (IRIDeS), Tohoku University, Japan (2010) Tsunami trace database: https://tsunami-db.irides.tohoku.ac.jp/tsunami/mainframe.php . Accessed 15 Aug 2023
Wald DJ, Somerville PG (1995) Variable-slip rupture model of the great 1923 Kanto, Japan, earthquake: geodetic and body waveform analysis. Bull Seismol Soc Am 85:159–177. https://doi.org/10.1785/bssa0850010159
Watanabe K (1993) Submarine micro-topography in the western part of Sagami Bay. Report of Hydrographic Researches (in Japanese) 29: 33–50. https://dl.ndl.go.jp/pid/3242697
Watts P, Grilli ST, Tappin DR, Fryer GJ (2005) Tsunami generation by submarine mass failure. II: predictive equations and case studies. J Waterw Port Coast Ocean Eng 131(6):298–310. https://doi.org/10.1061/(ASCE)0733-950X(2005)131:6(298)
Yoshida A, Harada M, Odawara K (2012) Vertical displacement of the seabed of Sagami Bay at the 1923 Kanto earthquake. Bull Hot Springs Research Inst Kanagawa Pref (in Japanese) 44:17–28
Download references
Acknowledgements
We would like to thank Dr. Yujiro Ogawa, emeritus professor of Tsukuba University, for his helpful discussions and comments in a geological study of the seabed of Sagami Bay, and Dr. Shigeru Kato, chairman of Japan Hydraulic Association (former Hydrographic and Ocean Graphic Department, Japan Coast Guard), for his insightful discussions and comments in a topography interpretation.
Author information
Authors and affiliations.
Port and Airport Research Institute, National Institute of Maritime, Port and Aviation Technology, Yokosuka, Japan
Kazuki Murata, Shinji Sassa & Tomohiro Takagawa
Institute of Physical and Chemical Research (RIKEN), Wako, Japan
Toshikazu Ebisuzaki
Department of Oceanic Architecture and Engineering, College of Science and Technology (CST), Nihon University, Chiba, Japan
Koichi Masuda, Takujiro Miyamoto & Masato Ohno
Tokyo Institute of Technology, Tokyo, Japan
Shigenori Maruyama
You can also search for this author in PubMed Google Scholar
Corresponding author
Correspondence to Kazuki Murata .
Ethics declarations
Competing interests.
The authors declare no competing interests.
Supplementary Information
Below is the link to the electronic supplementary material.
Supplementary file1 (DOCX 585 KB)
Supplementary file2 (docx 6180 kb), supplementary file3 (docx 857 kb), rights and permissions.
Open Access This article is licensed under a Creative Commons Attribution 4.0 International License, which permits use, sharing, adaptation, distribution and reproduction in any medium or format, as long as you give appropriate credit to the original author(s) and the source, provide a link to the Creative Commons licence, and indicate if changes were made. The images or other third party material in this article are included in the article's Creative Commons licence, unless indicated otherwise in a credit line to the material. If material is not included in the article's Creative Commons licence and your intended use is not permitted by statutory regulation or exceeds the permitted use, you will need to obtain permission directly from the copyright holder. To view a copy of this licence, visit http://creativecommons.org/licenses/by/4.0/ .
Reprints and permissions
About this article
Murata, K., Ebisuzaki, T., Sassa, S. et al. Submarine landslides and tsunami genesis in Sagami Bay, Japan, caused by the 1923 Great Kanto earthquake. Landslides (2024). https://doi.org/10.1007/s10346-024-02231-x
Download citation
Received : 17 October 2023
Accepted : 16 February 2024
Published : 17 April 2024
DOI : https://doi.org/10.1007/s10346-024-02231-x
Share this article
Anyone you share the following link with will be able to read this content:
Sorry, a shareable link is not currently available for this article.
Provided by the Springer Nature SharedIt content-sharing initiative
- 1923 Great Kanto earthquake
- Submarine landslides
- Liquefaction
- Depth changes
- Find a journal
- Publish with us
- Track your research
- Skip to main content
- Keyboard shortcuts for audio player
Weekend Edition Sunday
- Latest Show
Sunday Puzzle
- Corrections
Listen to the lead story from this episode.
Politics chat: What it'll take to win 2024
by Ayesha Rascoe , Mara Liasson
Middle East
6 months of war: palestinians say the u.s. government lacks empathy for their plight.
by Ayesha Rascoe
Threats and vulnerabilities cast a shadow on NATO's 75th anniversary

The Apple Pay app on an iPhone in New York. Consumers tend to spend about 10% more when they adopt mobile contactless payment methods, a researcher says. Jenny Kane/AP hide caption
Using your phone to pay is convenient, but it can also mean you spend more
by Matthew Schuerman , Ayesha Rascoe
Those in the path of totality for the eclipse might have to watch out for traffic
by Geoff Brumfiel
Environment
A group of volunteers will shepherd lake michigan fish's journey upstream.

Sunday Puzzle NPR hide caption
Sunday Puzzle: Idioms for the eclipse
by Greg Pliska , Will Shortz
The Cherokee community in North Carolina celebrates a high school championship win
by Laura Hackett
Music Interviews
Matt lowell of lo moon on the group's new album and going back to high school, 6 months of war: israelis say netanyahu isn't doing enough to bring home the hostages, 6 months of war: anger grows even in arab countries having peace treaties with israel.
by Jane Arraf
White House economist on the latest jobs report and where we stand with inflation
There are people still aboard the ship that crashed into the baltimore bridge, nevada bans camping in public spaces in response to its homelessness crisis.
by Bert Johnson
Why some voters are convinced Biden won't really be on the ballot in November
by Tamara Keith
Kentucky's gambling addiction cases may be more than it can handle
by Jacob Munoz
Here's what NASA's looking for in the next generation of astronauts
Movie interviews, a new documentary follows hundreds of high school girls forming a mock government.
Searching for a song you heard between stories? We've retired music buttons on these pages. Learn more here.
IMAGES
VIDEO
COMMENTS
Location: The earthquake struck 250 miles off the northeastern coast of Japan's Honshu Island at 2:46 pm (local time) on March 11, 2011. Japan 2011 Earthquake map. Magnitude: It measured 9.1 on the Moment Magnitude scale, making it one of the most powerful earthquakes ever recorded. Japan is a highly developed country with advanced ...
Case study: Japan tsunami 2011 (HIC) On Friday 11 March 2011 at 14:46:24, an earthquake of magnitude nine on the Richter scale close Richter scale The measure by which the strength of earthquakes ...
A massive tsunami, generated by a powerful undersea earthquake, breaching the seawall at Miyako, Japan, March 11, 2011. (more) The magnitude-9.0 earthquake struck at 2:46 pm. (The early estimate of magnitude 8.9 was later revised upward.) The epicentre was located some 80 miles (130 km) east of the city of Sendai, Miyagi prefecture, and the ...
What were the primary effects of the 2011 Japan earthquake? Impacts on people. Death and injury - Some 15,894 people died, and 26,152 people were injured. 130,927 people were displaced, and 2,562 remain missing. Damage - 332,395 buildings, 2,126 roads, 56 bridges and 26 railways were destroyed or damaged. 300 hospitals were damaged, and 11 ...
We revisited the lessons of the 2011 Great East Japan Earthquake Tsunami disaster specifically on the response and impact, ... Throughout the case study in Sendai city, the proposed reconstruction plan was evaluated from the tsunami engineering point of view to discuss how the post 2011 paradigm was implemented in coastal communities for future ...
The 2011 Tōhoku earthquake and tsunami had a great environmental impact on Japan's eastern coast. The rarity and magnitude of the earthquake-tsunami prompted researchers Jotaro Urabe , Takao Suzuki, Tatsuki Nishita, and Wataru Makino to study their immediate ecological impacts on intertidal flat communities at Sendai Bay and the Sanriku Ria coast.
1 Introduction. The Tohoku-oki earthquake occurred off the Pacific coast of the Tohoku region of Japan, on March 11, 2011 (Figures 1 and 2).The official moment magnitude (Mw) of the earthquake is Mw 9.0 or 9.1 according to the Japan Meteorological Agency (JMA) (Hirose et al., 2011) and United States Geological Survey (Duputel et al., 2012), respectively.
The most devastating earthquake to strike Japan was in 1923, when a magnitude 7.9 tremor devastated Tokyo and Yokohama and killed an estimated 142,800 people. The Kobe earthquake in 1995 was a ...
The 2011 earthquake has been the subject of intense study ever since, and the trench that produced it is the best studied in the world. (See " Japan Tsunami: 20 Unforgettable Pictures .")
Japan earthquake and tsunami of 2011 - Aftermath, Recovery, Rebuilding: The number of those confirmed dead or listed as missing was about 18,500. Most of those killed were drowning victims of the tsunami waves. Miyagi prefecture suffered the greatest losses. The tsunami waves damaged the backup generators at some of the nuclear plants, most notably at the Fukushima Daiichi plant.
The Tsunami Began in Northern Japan. On March 11, 2011, a 9.1 earthquake occurred near Japan, shifting the earth 200 feet along a fault line under the sea. The epicenter was located 45 miles east of the city of Sendai out in the Pacific Ocean. It was almost 3:00 in the afternoon when the earthquake started, and the shaking lasted for 6 minutes.
Members of the Japanese Ground Self-Defense Force in rescue and recovery operations in Ōfunato, Iwate prefecture, Japan, after the city was devastated by the March 11, 2011, earthquake and tsunami. In the first hours after the earthquake, Japanese Prime Minister Kan Naoto moved to set up an emergency command centre in Tokyo, and a large number ...
The damage makes the 2011 Great East Japan earthquake and tsunami the most expensive natural disaster in history. Although the majority of the tsunami's impact was in Japan, the event was truly global. The tsunami was observed at coastal sea level gauges in over 25 Pacific Rim countries, in Antarctica, and on the west coast of the Atlantic ...
Case Study: How does Japan live with earthquakes? Japan lies within one of the most tectonically active zones in the world. It experiences over 400 earthquakes every day. ... The tsunami in 2011 claimed the lives of 15,853 people and injured 6023. The majority of the victims were over the age of 60 (66%). 90% of the deaths was caused by ...
This cliff is a scar of the 2011 Tōhoku earthquake that struck off Japan's eastern shores. That year, on March 11, the magnitude 9.1 temblor deep within the Pacific Ocean unleashed a ...
1. Introduction [2] On March 11, 2011, the 2011 Tohoku-Oki earthquake occurred off the Pacific coast of northeastern Honshu, Japan. The event was a dip-slip rupture of the plate boundary between the Pacific and North America plates, and the moment magnitude (M W) of this event was 9.0, which is the largest value ever recorded in Japan.This gigantic event excited a huge tsunami, which struck ...
Part IV Case studies: Africa; Part V Case studies: the Middle East; Part VI Case studies: Asia and the Pacific Region; 21 The Chao Phraya floods 2011; 22 Environmental risk management in Australia: natural hazards; 23 The 2008 Wenchuan, China, earthquake; 24 The 2011 Tohoku, Japan, earthquake and tsunami; 25 India's tsunami warning system
[1] At 14:46 local time on March 11, 2011, a magnitude 9.0 earthquake occurred off the coast of northeast Japan. This earthquake generated a tsunami that struck Japan as well as various locations around the Pacific Ocean. With the participation of researchers from throughout Japan, joint research groups conducted a tsunami survey along a 2000 km stretch of the Japanese coast.
This article presents a case study on tsunami risk assessment performed by Asahi Kasei Corporation, Japan, based on four steps: (1) review of Natech events caused by the 2011 Great East Japan Earthquake, (2) hazard identification at the plant, (3) risk assessment considering human casualties, equipment loss, environment, and business continuity ...
Identifying tsunami traces beyond sandy tsunami deposits using terrigenous biomarkers: a case study of the 2011 Tohoku-oki tsunami in a coastal pine forest, northern Japan The distributions of sandy tsunami deposits do not reflect the true extents of tsunami inundation areas, leading to underestimates of inundation by past tsunamis and thus the ...
The authors will use Otsuchi Town in Iwate Prefecture as a case study, as this was one of the settlements worst hit by the disaster and can serve to highlight the particular socio-economical and demographic challenges facing the region. ... Lessons learned from the 2011 Great East Japan tsunami: performance of tsunami countermeasures, coastal ...
The earthquake struck on March 11, 2011, at 2:46 pm local time. The epicenter was located about 80 miles (130 kilometers) east of the city of Sendai, which is in Miyagi prefecture. With a magnitude of 9.0 on the Richter scale, it was one of the most powerful earthquakes ever recorded. Hundreds of aftershocks followed in the days and weeks after ...
Title: Tohoku Earthquake and Tsunami 2011 - Case Study - World at Risk - Edexcel Geography IAL Created Date: 20191125163816Z
Shinozaki, T. et al. Identifying tsunami traces beyond sandy tsunami deposits using terrigenous biomarkers: a case study of the 2011 Tohoku-oki tsunami in a coastal pine forest, northern Japan ...
As part of the Pacific "ring of fire," Japan is one of the world's most earthquake-prone areas. A magnitude 9.0 earthquake and subsequent tsunami in March 2011 devastated large areas along ...
The 1923 Great Kanto earthquake occurred on September 1, in Japan, and caused severe damage mainly in the Kanto region. Tsunamis were observed over wide regions from the east coast of the Izu Peninsula to the west coast of the Boso Peninsula, and particularly, the damage in Atami was devastating. Many earthquake fault models including those of Kanamori (1971) and Ando (1971) were proposed ...
Hear the Weekend Edition Sunday program for April 7, 2024