Descriptive Research Design – Overview
Published 16 October, 2023
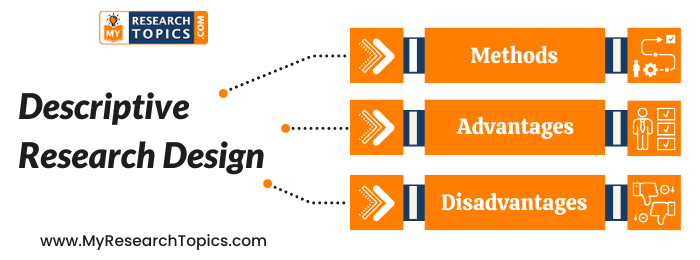
Descriptive research is an observational method that focuses on identifying patterns in data without making inferences about cause and effect relationships between variables. The purpose of this blog post is to provide a brief description of descriptive research design including its advantages and disadvantages and methods of conducting descriptive research.

What is Descriptive Research?
Descriptive research is a process of systematically describing and analyzing something’s features, properties or characteristics. Descriptive research provides numerical descriptions that identify what the thing being studied looks like in terms of its size, location, and frequency.
This type of research will help you in defining the characteristics of the population on which you have performed the study. A descriptive research design enables you to develop an in-depth understanding of the topic or subjects. In such a type of investigation, you can’t have control over variables.
By performing descriptive research, you will be able to study participants in a natural setting. Descriptive research basically includes describing the behavior of people to whom you have select as a participant in the research process .
In addition to this , descriptive research also allows you to describe the other various aspects of your investigation. An important feature is that you can employ different types of variables but you only need a single variable for performing the descriptive investigation. It is a type of study which includes observation as a technique for gathering facts about the study. You can perform descriptive research for analyzing the relationship between two different variables.
For example, A company whose sale of specific products such as home decor products is going down. Management, in order to analyze the reason for the same, needs to conduct descriptive research. Survey Research is the data collection technique that a research team in an organization can use for collecting the view of people about the decline in the sale of home décor products.
When to Use Descriptive Research Design
Descriptive research is suitable when the aim of the study is to identify characteristics, frequencies, trends, categories, and the behavior of people.
In addition to this, the descriptive research design is appropriate to use when you don’t have much knowledge about the research topics or problems.
This type of study can be used before you start researching why something happens so that we have an idea on how it occurs, where are most likely places this will happen at and who might experience these things more often than others.
Advantages of Descriptive Research
- One of the biggest advantages of descriptive research is that it allows you to analyze facts and helps you in developing an in-depth understanding of the research problem .
- Another benefit of descriptive research is that it enables you to determine the behavior of people in a natural setting.
- In such a type of investigation, you can utilize both qualitative and quantitative research methods for gathering facts.
- Descriptive research is cost-effective and quick. It can also be used for many different purposes, which makes it a very versatile method of gathering data.
- You need less time for performing such types of research .
- With descriptive research, you can get rich data that’s great for future studies. Use it to develop hypotheses or your research objective too!
Disadvantages of Descriptive Research
- The biggest disadvantage of descriptive research is that you cannot use statistical tools or techniques for verifying problems.
- Respondents can be affected by the presence of an observer and may engage in pretending. This is called the “observer effect.” In some cases, respondents are less likely to give accurate responses if they feel that a question will assess intimate matters.
- There are high chances of biases in the research findings .
- Due to the observational nature, it is quite difficult to repeat the research process .
- By performing descriptive research you can find the root cause of the problem.
Methods of Descriptive Research Design
You can utilize both Qualitative and Quantitative methods for performing descriptive research. It is very much essential for you to make the choice of a suitable research design for investigation as the reliability and validity of the research outcomes are completely based on it. There are three different methods that you can use in descriptive research are:
It is the method that includes a detailed description of the subject or topic. The survey is the method by utilizing which you can collect a huge volume of facts about the topic or subject.
You can use a survey technique for directly accumulating information about the perception of people about the topic. The methods which can be applied for performing a survey in descriptive research are questionnaires, telephonic and personal interviews . In descriptive studies, generally, open-ended questions are included in a questionnaire.
2. Observation
It is basically a technique that the researcher utilities for observing and recording participants. By utilizing this technique you can easily view the subject in a natural setting.
Observations are a way of gathering data that can be used to understand how people act in real-life situations. These observations give researchers the opportunity to see behaviors and phenomena without having them rely on honesty or accuracy from respondents, which is often useful for psychologists, social scientists, and market research companies. Furthermore, observations play an important role in understanding things such as physical entities before developing models hypotheses, or theories – because they provide systematic descriptions of what’s being investigated
For example, an investigation is performed for gathering information about the buying decision-making procedure by customers. The investigator for collecting the facts about the topic has observed people in shopping malls while they are making the purchase of specific products or services. By using the observation technique you can ensure the accuracy and honesty in the information provided by respondents.
3. Case study
You can use the case study methods in research for gathering an in-depth understanding of specific phenomena. It is the method that would enable you to study the situation which takes place rarely
Case studies are a great way to provide detailed information about an individual (such as yourself), group, event, or organization. Instead of gathering data across time and space in order to identify patterns, case studies gather extensive detailed data to identify the characteristics of a narrowly defined subject.
Stuck During Your Dissertation
Our top dissertation writing experts are waiting 24/7 to assist you with your university project,from critical literature reviews to a complete PhD dissertation.

Other Related Guides
- Research Project Questions
- Types of Validity in Research – Explained With Examples
- Schizophrenia Sample Research Paper
- Quantitative Research Methods – Definitive Guide
- Research Paper On Homelessness For College Students
- How to Study for Biology Final Examination
- Textual Analysis in Research / Methods of Analyzing Text
A Guide to Start Research Process – Introduction, Procedure and Tips
Research findings – objectives , importance and techniques.
- Topic Sentences in Research Paper – Meaning, Parts, Importance, Procedure and Techniques

Recent Research Guides for 2023

Get 15% off your first order with My Research Topics
Connect with a professional writer within minutes by placing your first order. No matter the subject, difficulty, academic level or document type, our writers have the skills to complete it.

My Research Topics is provides assistance since 2004 to Research Students Globally. We help PhD, Psyd, MD, Mphil, Undergrad, High school, College, Masters students to compete their research paper & Dissertations. Our Step by step mentorship helps students to understand the research paper making process.
Research Topics & Ideas
- Sociological Research Paper Topics & Ideas For Students 2023
- Nurses Research Paper Topics & Ideas 2023
- Nursing Capstone Project Research Topics & Ideas 2023
- Unique Research Paper Topics & Ideas For Students 2023
- Teaching Research Paper Topics & Ideas 2023
- Literary Research Paper Topics & Ideas 2023
- Nursing Ethics Research Topics & Ideas 2023
Research Guide
Disclaimer: The Reference papers provided by the Myresearchtopics.com serve as model and sample papers for students and are not to be submitted as it is. These papers are intended to be used for reference and research purposes only.
- Skip to main content
- Skip to primary sidebar
- Skip to footer
- QuestionPro

- Solutions Industries Gaming Automotive Sports and events Education Government Travel & Hospitality Financial Services Healthcare Cannabis Technology Use Case NPS+ Communities Audience Contactless surveys Mobile LivePolls Member Experience GDPR Positive People Science 360 Feedback Surveys
- Resources Blog eBooks Survey Templates Case Studies Training Help center
Home Market Research
Descriptive Research: Definition, Characteristics, Methods + Examples

Suppose an apparel brand wants to understand the fashion purchasing trends among New York’s buyers, then it must conduct a demographic survey of the specific region, gather population data, and then conduct descriptive research on this demographic segment.
The study will then uncover details on “what is the purchasing pattern of New York buyers,” but will not cover any investigative information about “ why ” the patterns exist. Because for the apparel brand trying to break into this market, understanding the nature of their market is the study’s main goal. Let’s talk about it.
What is descriptive research?
Descriptive research is a research method describing the characteristics of the population or phenomenon studied. This descriptive methodology focuses more on the “what” of the research subject than the “why” of the research subject.
The method primarily focuses on describing the nature of a demographic segment without focusing on “why” a particular phenomenon occurs. In other words, it “describes” the research subject without covering “why” it happens.
Characteristics of descriptive research
The term descriptive research then refers to research questions, the design of the study, and data analysis conducted on that topic. We call it an observational research method because none of the research study variables are influenced in any capacity.
Some distinctive characteristics of descriptive research are:
- Quantitative research: It is a quantitative research method that attempts to collect quantifiable information for statistical analysis of the population sample. It is a popular market research tool that allows us to collect and describe the demographic segment’s nature.
- Uncontrolled variables: In it, none of the variables are influenced in any way. This uses observational methods to conduct the research. Hence, the nature of the variables or their behavior is not in the hands of the researcher.
- Cross-sectional studies: It is generally a cross-sectional study where different sections belonging to the same group are studied.
- The basis for further research: Researchers further research the data collected and analyzed from descriptive research using different research techniques. The data can also help point towards the types of research methods used for the subsequent research.
Applications of descriptive research with examples
A descriptive research method can be used in multiple ways and for various reasons. Before getting into any survey , though, the survey goals and survey design are crucial. Despite following these steps, there is no way to know if one will meet the research outcome. How to use descriptive research? To understand the end objective of research goals, below are some ways organizations currently use descriptive research today:
- Define respondent characteristics: The aim of using close-ended questions is to draw concrete conclusions about the respondents. This could be the need to derive patterns, traits, and behaviors of the respondents. It could also be to understand from a respondent their attitude, or opinion about the phenomenon. For example, understand millennials and the hours per week they spend browsing the internet. All this information helps the organization researching to make informed business decisions.
- Measure data trends: Researchers measure data trends over time with a descriptive research design’s statistical capabilities. Consider if an apparel company researches different demographics like age groups from 24-35 and 36-45 on a new range launch of autumn wear. If one of those groups doesn’t take too well to the new launch, it provides insight into what clothes are like and what is not. The brand drops the clothes and apparel that customers don’t like.
- Conduct comparisons: Organizations also use a descriptive research design to understand how different groups respond to a specific product or service. For example, an apparel brand creates a survey asking general questions that measure the brand’s image. The same study also asks demographic questions like age, income, gender, geographical location, geographic segmentation , etc. This consumer research helps the organization understand what aspects of the brand appeal to the population and what aspects do not. It also helps make product or marketing fixes or even create a new product line to cater to high-growth potential groups.
- Validate existing conditions: Researchers widely use descriptive research to help ascertain the research object’s prevailing conditions and underlying patterns. Due to the non-invasive research method and the use of quantitative observation and some aspects of qualitative observation , researchers observe each variable and conduct an in-depth analysis . Researchers also use it to validate any existing conditions that may be prevalent in a population.
- Conduct research at different times: The analysis can be conducted at different periods to ascertain any similarities or differences. This also allows any number of variables to be evaluated. For verification, studies on prevailing conditions can also be repeated to draw trends.
Advantages of descriptive research
Some of the significant advantages of descriptive research are:

- Data collection: A researcher can conduct descriptive research using specific methods like observational method, case study method, and survey method. Between these three, all primary data collection methods are covered, which provides a lot of information. This can be used for future research or even for developing a hypothesis for your research object.
- Varied: Since the data collected is qualitative and quantitative, it gives a holistic understanding of a research topic. The information is varied, diverse, and thorough.
- Natural environment: Descriptive research allows for the research to be conducted in the respondent’s natural environment, which ensures that high-quality and honest data is collected.
- Quick to perform and cheap: As the sample size is generally large in descriptive research, the data collection is quick to conduct and is inexpensive.
Descriptive research methods
There are three distinctive methods to conduct descriptive research. They are:
Observational method
The observational method is the most effective method to conduct this research, and researchers make use of both quantitative and qualitative observations.
A quantitative observation is the objective collection of data primarily focused on numbers and values. It suggests “associated with, of or depicted in terms of a quantity.” Results of quantitative observation are derived using statistical and numerical analysis methods. It implies observation of any entity associated with a numeric value such as age, shape, weight, volume, scale, etc. For example, the researcher can track if current customers will refer the brand using a simple Net Promoter Score question .
Qualitative observation doesn’t involve measurements or numbers but instead just monitoring characteristics. In this case, the researcher observes the respondents from a distance. Since the respondents are in a comfortable environment, the characteristics observed are natural and effective. In a descriptive research design, the researcher can choose to be either a complete observer, an observer as a participant, a participant as an observer, or a full participant. For example, in a supermarket, a researcher can from afar monitor and track the customers’ selection and purchasing trends. This offers a more in-depth insight into the purchasing experience of the customer.
Case study method
Case studies involve in-depth research and study of individuals or groups. Case studies lead to a hypothesis and widen a further scope of studying a phenomenon. However, case studies should not be used to determine cause and effect as they can’t make accurate predictions because there could be a bias on the researcher’s part. The other reason why case studies are not a reliable way of conducting descriptive research is that there could be an atypical respondent in the survey. Describing them leads to weak generalizations and moving away from external validity.
Survey research
In survey research, respondents answer through surveys or questionnaires or polls . They are a popular market research tool to collect feedback from respondents. A study to gather useful data should have the right survey questions. It should be a balanced mix of open-ended questions and close ended-questions . The survey method can be conducted online or offline, making it the go-to option for descriptive research where the sample size is enormous.
Examples of descriptive research
Some examples of descriptive research are:
- A specialty food group launching a new range of barbecue rubs would like to understand what flavors of rubs are favored by different people. To understand the preferred flavor palette, they conduct this type of research study using various methods like observational methods in supermarkets. By also surveying while collecting in-depth demographic information, offers insights about the preference of different markets. This can also help tailor make the rubs and spreads to various preferred meats in that demographic. Conducting this type of research helps the organization tweak their business model and amplify marketing in core markets.
- Another example of where this research can be used is if a school district wishes to evaluate teachers’ attitudes about using technology in the classroom. By conducting surveys and observing their comfortableness using technology through observational methods, the researcher can gauge what they can help understand if a full-fledged implementation can face an issue. This also helps in understanding if the students are impacted in any way with this change.
Some other research problems and research questions that can lead to descriptive research are:
- Market researchers want to observe the habits of consumers.
- A company wants to evaluate the morale of its staff.
- A school district wants to understand if students will access online lessons rather than textbooks.
- To understand if its wellness questionnaire programs enhance the overall health of the employees.
FREE TRIAL LEARN MORE
MORE LIKE THIS

Top 20 Employee Engagement Software Solutions
May 3, 2024

15 Best Customer Experience Software of 2024
May 2, 2024

Journey Orchestration Platforms: Top 11 Platforms in 2024

Top 12 Employee Pulse Survey Tools Unlocking Insights in 2024
May 1, 2024
Other categories
- Academic Research
- Artificial Intelligence
- Assessments
- Brand Awareness
- Case Studies
- Communities
- Consumer Insights
- Customer effort score
- Customer Engagement
- Customer Experience
- Customer Loyalty
- Customer Research
- Customer Satisfaction
- Employee Benefits
- Employee Engagement
- Employee Retention
- Friday Five
- General Data Protection Regulation
- Insights Hub
- Life@QuestionPro
- Market Research
- Mobile diaries
- Mobile Surveys
- New Features
- Online Communities
- Question Types
- Questionnaire
- QuestionPro Products
- Release Notes
- Research Tools and Apps
- Revenue at Risk
- Survey Templates
- Training Tips
- Uncategorized
- Video Learning Series
- What’s Coming Up
- Workforce Intelligence
Root out friction in every digital experience, super-charge conversion rates, and optimize digital self-service
Uncover insights from any interaction, deliver AI-powered agent coaching, and reduce cost to serve
Increase revenue and loyalty with real-time insights and recommendations delivered to teams on the ground
Know how your people feel and empower managers to improve employee engagement, productivity, and retention
Take action in the moments that matter most along the employee journey and drive bottom line growth
Whatever they’re are saying, wherever they’re saying it, know exactly what’s going on with your people
Get faster, richer insights with qual and quant tools that make powerful market research available to everyone
Run concept tests, pricing studies, prototyping + more with fast, powerful studies designed by UX research experts
Track your brand performance 24/7 and act quickly to respond to opportunities and challenges in your market
Explore the platform powering Experience Management
- Free Account
- For Digital
- For Customer Care
- For Human Resources
- For Researchers
- Financial Services
- All Industries
Popular Use Cases
- Customer Experience
- Employee Experience
- Net Promoter Score
- Voice of Customer
- Customer Success Hub
- Product Documentation
- Training & Certification
- XM Institute
- Popular Resources
- Customer Stories
- Artificial Intelligence
Market Research
- Partnerships
- Marketplace
The annual gathering of the experience leaders at the world’s iconic brands building breakthrough business results, live in Salt Lake City.
- English/AU & NZ
- Español/Europa
- Español/América Latina
- Português Brasileiro
- REQUEST DEMO
- Experience Management
- Descriptive Research
Try Qualtrics for free
Descriptive research: what it is and how to use it.
8 min read Understanding the who, what and where of a situation or target group is an essential part of effective research and making informed business decisions.
For example you might want to understand what percentage of CEOs have a bachelor’s degree or higher. Or you might want to understand what percentage of low income families receive government support – or what kind of support they receive.
Descriptive research is what will be used in these types of studies.
In this guide we’ll look through the main issues relating to descriptive research to give you a better understanding of what it is, and how and why you can use it.
Free eBook: 2024 global market research trends report
What is descriptive research?
Descriptive research is a research method used to try and determine the characteristics of a population or particular phenomenon.
Using descriptive research you can identify patterns in the characteristics of a group to essentially establish everything you need to understand apart from why something has happened.
Market researchers use descriptive research for a range of commercial purposes to guide key decisions.
For example you could use descriptive research to understand fashion trends in a given city when planning your clothing collection for the year. Using descriptive research you can conduct in depth analysis on the demographic makeup of your target area and use the data analysis to establish buying patterns.
Conducting descriptive research wouldn’t, however, tell you why shoppers are buying a particular type of fashion item.
Descriptive research design
Descriptive research design uses a range of both qualitative research and quantitative data (although quantitative research is the primary research method) to gather information to make accurate predictions about a particular problem or hypothesis.
As a survey method, descriptive research designs will help researchers identify characteristics in their target market or particular population.
These characteristics in the population sample can be identified, observed and measured to guide decisions.
Descriptive research characteristics
While there are a number of descriptive research methods you can deploy for data collection, descriptive research does have a number of predictable characteristics.
Here are a few of the things to consider:
Measure data trends with statistical outcomes
Descriptive research is often popular for survey research because it generates answers in a statistical form, which makes it easy for researchers to carry out a simple statistical analysis to interpret what the data is saying.
Descriptive research design is ideal for further research
Because the data collection for descriptive research produces statistical outcomes, it can also be used as secondary data for another research study.
Plus, the data collected from descriptive research can be subjected to other types of data analysis .
Uncontrolled variables
A key component of the descriptive research method is that it uses random variables that are not controlled by the researchers. This is because descriptive research aims to understand the natural behavior of the research subject.
It’s carried out in a natural environment
Descriptive research is often carried out in a natural environment. This is because researchers aim to gather data in a natural setting to avoid swaying respondents.
Data can be gathered using survey questions or online surveys.
For example, if you want to understand the fashion trends we mentioned earlier, you would set up a study in which a researcher observes people in the respondent’s natural environment to understand their habits and preferences.
Descriptive research allows for cross sectional study
Because of the nature of descriptive research design and the randomness of the sample group being observed, descriptive research is ideal for cross sectional studies – essentially the demographics of the group can vary widely and your aim is to gain insights from within the group.
This can be highly beneficial when you’re looking to understand the behaviors or preferences of a wider population.
Descriptive research advantages
There are many advantages to using descriptive research, some of them include:
Cost effectiveness
Because the elements needed for descriptive research design are not specific or highly targeted (and occur within the respondent’s natural environment) this type of study is relatively cheap to carry out.
Multiple types of data can be collected
A big advantage of this research type, is that you can use it to collect both quantitative and qualitative data. This means you can use the stats gathered to easily identify underlying patterns in your respondents’ behavior.
Descriptive research disadvantages
Potential reliability issues.
When conducting descriptive research it’s important that the initial survey questions are properly formulated.
If not, it could make the answers unreliable and risk the credibility of your study.
Potential limitations
As we’ve mentioned, descriptive research design is ideal for understanding the what, who or where of a situation or phenomenon.
However, it can’t help you understand the cause or effect of the behavior. This means you’ll need to conduct further research to get a more complete picture of a situation.
Descriptive research methods
Because descriptive research methods include a range of quantitative and qualitative research, there are several research methods you can use.
Use case studies
Case studies in descriptive research involve conducting in-depth and detailed studies in which researchers get a specific person or case to answer questions.
Case studies shouldn’t be used to generate results, rather it should be used to build or establish hypothesis that you can expand into further market research .
For example you could gather detailed data about a specific business phenomenon, and then use this deeper understanding of that specific case.
Use observational methods
This type of study uses qualitative observations to understand human behavior within a particular group.
By understanding how the different demographics respond within your sample you can identify patterns and trends.
As an observational method, descriptive research will not tell you the cause of any particular behaviors, but that could be established with further research.
Use survey research
Surveys are one of the most cost effective ways to gather descriptive data.
An online survey or questionnaire can be used in descriptive studies to gather quantitative information about a particular problem.
Survey research is ideal if you’re using descriptive research as your primary research.
Descriptive research examples
Descriptive research is used for a number of commercial purposes or when organizations need to understand the behaviors or opinions of a population.
One of the biggest examples of descriptive research that is used in every democratic country, is during elections.
Using descriptive research, researchers will use surveys to understand who voters are more likely to choose out of the parties or candidates available.
Using the data provided, researchers can analyze the data to understand what the election result will be.
In a commercial setting, retailers often use descriptive research to figure out trends in shopping and buying decisions.
By gathering information on the habits of shoppers, retailers can get a better understanding of the purchases being made.
Another example that is widely used around the world, is the national census that takes place to understand the population.
The research will provide a more accurate picture of a population’s demographic makeup and help to understand changes over time in areas like population age, health and education level.
Where Qualtrics helps with descriptive research
Whatever type of research you want to carry out, there’s a survey type that will work.
Qualtrics can help you determine the appropriate method and ensure you design a study that will deliver the insights you need.
Our experts can help you with your market research needs , ensuring you get the most out of Qualtrics market research software to design, launch and analyze your data to guide better, more accurate decisions for your organization.
Related resources
Market intelligence 10 min read, marketing insights 11 min read, ethnographic research 11 min read, qualitative vs quantitative research 13 min read, qualitative research questions 11 min read, qualitative research design 12 min read, primary vs secondary research 14 min read, request demo.
Ready to learn more about Qualtrics?

Bridging the Gap: Overcome these 7 flaws in descriptive research design
Descriptive research design is a powerful tool used by scientists and researchers to gather information about a particular group or phenomenon. This type of research provides a detailed and accurate picture of the characteristics and behaviors of a particular population or subject. By observing and collecting data on a given topic, descriptive research helps researchers gain a deeper understanding of a specific issue and provides valuable insights that can inform future studies.
In this blog, we will explore the definition, characteristics, and common flaws in descriptive research design, and provide tips on how to avoid these pitfalls to produce high-quality results. Whether you are a seasoned researcher or a student just starting, understanding the fundamentals of descriptive research design is essential to conducting successful scientific studies.
Table of Contents
What Is Descriptive Research Design?
The descriptive research design involves observing and collecting data on a given topic without attempting to infer cause-and-effect relationships. The goal of descriptive research is to provide a comprehensive and accurate picture of the population or phenomenon being studied and to describe the relationships, patterns, and trends that exist within the data.
Descriptive research methods can include surveys, observational studies , and case studies, and the data collected can be qualitative or quantitative . The findings from descriptive research provide valuable insights and inform future research, but do not establish cause-and-effect relationships.
Importance of Descriptive Research in Scientific Studies
1. understanding of a population or phenomenon.
Descriptive research provides a comprehensive picture of the characteristics and behaviors of a particular population or phenomenon, allowing researchers to gain a deeper understanding of the topic.
2. Baseline Information
The information gathered through descriptive research can serve as a baseline for future research and provide a foundation for further studies.
3. Informative Data
Descriptive research can provide valuable information and insights into a particular topic, which can inform future research, policy decisions, and programs.
4. Sampling Validation
Descriptive research can be used to validate sampling methods and to help researchers determine the best approach for their study.
5. Cost Effective
Descriptive research is often less expensive and less time-consuming than other research methods , making it a cost-effective way to gather information about a particular population or phenomenon.
6. Easy to Replicate
Descriptive research is straightforward to replicate, making it a reliable way to gather and compare information from multiple sources.
Key Characteristics of Descriptive Research Design
The primary purpose of descriptive research is to describe the characteristics, behaviors, and attributes of a particular population or phenomenon.
2. Participants and Sampling
Descriptive research studies a particular population or sample that is representative of the larger population being studied. Furthermore, sampling methods can include convenience, stratified, or random sampling.
3. Data Collection Techniques
Descriptive research typically involves the collection of both qualitative and quantitative data through methods such as surveys, observational studies, case studies, or focus groups.
4. Data Analysis
Descriptive research data is analyzed to identify patterns, relationships, and trends within the data. Statistical techniques , such as frequency distributions and descriptive statistics, are commonly used to summarize and describe the data.
5. Focus on Description
Descriptive research is focused on describing and summarizing the characteristics of a particular population or phenomenon. It does not make causal inferences.
6. Non-Experimental
Descriptive research is non-experimental, meaning that the researcher does not manipulate variables or control conditions. The researcher simply observes and collects data on the population or phenomenon being studied.
When Can a Researcher Conduct Descriptive Research?
A researcher can conduct descriptive research in the following situations:
- To better understand a particular population or phenomenon
- To describe the relationships between variables
- To describe patterns and trends
- To validate sampling methods and determine the best approach for a study
- To compare data from multiple sources.
Types of Descriptive Research Design
1. survey research.
Surveys are a type of descriptive research that involves collecting data through self-administered or interviewer-administered questionnaires. Additionally, they can be administered in-person, by mail, or online, and can collect both qualitative and quantitative data.
2. Observational Research
Observational research involves observing and collecting data on a particular population or phenomenon without manipulating variables or controlling conditions. It can be conducted in naturalistic settings or controlled laboratory settings.
3. Case Study Research
Case study research is a type of descriptive research that focuses on a single individual, group, or event. It involves collecting detailed information on the subject through a variety of methods, including interviews, observations, and examination of documents.
4. Focus Group Research
Focus group research involves bringing together a small group of people to discuss a particular topic or product. Furthermore, the group is usually moderated by a researcher and the discussion is recorded for later analysis.
5. Ethnographic Research
Ethnographic research involves conducting detailed observations of a particular culture or community. It is often used to gain a deep understanding of the beliefs, behaviors, and practices of a particular group.
Advantages of Descriptive Research Design
1. provides a comprehensive understanding.
Descriptive research provides a comprehensive picture of the characteristics, behaviors, and attributes of a particular population or phenomenon, which can be useful in informing future research and policy decisions.
2. Non-invasive
Descriptive research is non-invasive and does not manipulate variables or control conditions, making it a suitable method for sensitive or ethical concerns.
3. Flexibility
Descriptive research allows for a wide range of data collection methods , including surveys, observational studies, case studies, and focus groups, making it a flexible and versatile research method.
4. Cost-effective
Descriptive research is often less expensive and less time-consuming than other research methods. Moreover, it gives a cost-effective option to many researchers.
5. Easy to Replicate
Descriptive research is easy to replicate, making it a reliable way to gather and compare information from multiple sources.
6. Informs Future Research
The insights gained from a descriptive research can inform future research and inform policy decisions and programs.
Disadvantages of Descriptive Research Design
1. limited scope.
Descriptive research only provides a snapshot of the current situation and cannot establish cause-and-effect relationships.
2. Dependence on Existing Data
Descriptive research relies on existing data, which may not always be comprehensive or accurate.
3. Lack of Control
Researchers have no control over the variables in descriptive research, which can limit the conclusions that can be drawn.
The researcher’s own biases and preconceptions can influence the interpretation of the data.
5. Lack of Generalizability
Descriptive research findings may not be applicable to other populations or situations.
6. Lack of Depth
Descriptive research provides a surface-level understanding of a phenomenon, rather than a deep understanding.
7. Time-consuming
Descriptive research often requires a large amount of data collection and analysis, which can be time-consuming and resource-intensive.
7 Ways to Avoid Common Flaws While Designing Descriptive Research
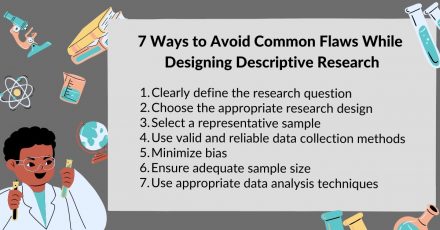
1. Clearly define the research question
A clearly defined research question is the foundation of any research study, and it is important to ensure that the question is both specific and relevant to the topic being studied.
2. Choose the appropriate research design
Choosing the appropriate research design for a study is crucial to the success of the study. Moreover, researchers should choose a design that best fits the research question and the type of data needed to answer it.
3. Select a representative sample
Selecting a representative sample is important to ensure that the findings of the study are generalizable to the population being studied. Researchers should use a sampling method that provides a random and representative sample of the population.
4. Use valid and reliable data collection methods
Using valid and reliable data collection methods is important to ensure that the data collected is accurate and can be used to answer the research question. Researchers should choose methods that are appropriate for the study and that can be administered consistently and systematically.
5. Minimize bias
Bias can significantly impact the validity and reliability of research findings. Furthermore, it is important to minimize bias in all aspects of the study, from the selection of participants to the analysis of data.
6. Ensure adequate sample size
An adequate sample size is important to ensure that the results of the study are statistically significant and can be generalized to the population being studied.
7. Use appropriate data analysis techniques
The appropriate data analysis technique depends on the type of data collected and the research question being asked. Researchers should choose techniques that are appropriate for the data and the question being asked.
Have you worked on descriptive research designs? How was your experience creating a descriptive design? What challenges did you face? Do write to us or leave a comment below and share your insights on descriptive research designs!

extremely very educative
Indeed very educative and useful. Well explained. Thank you
Simple,easy to understand
Rate this article Cancel Reply
Your email address will not be published.

Enago Academy's Most Popular Articles

- Publishing Research
- Reporting Research
How to Optimize Your Research Process: A step-by-step guide
For researchers across disciplines, the path to uncovering novel findings and insights is often filled…

- Industry News
- Trending Now
Breaking Barriers: Sony and Nature unveil “Women in Technology Award”
Sony Group Corporation and the prestigious scientific journal Nature have collaborated to launch the inaugural…

Achieving Research Excellence: Checklist for good research practices
Academia is built on the foundation of trustworthy and high-quality research, supported by the pillars…

- Promoting Research
Plain Language Summary — Communicating your research to bridge the academic-lay gap
Science can be complex, but does that mean it should not be accessible to the…

Science under Surveillance: Journals adopt advanced AI to uncover image manipulation
Journals are increasingly turning to cutting-edge AI tools to uncover deceitful images published in manuscripts.…
Choosing the Right Analytical Approach: Thematic analysis vs. content analysis for…
Comparing Cross Sectional and Longitudinal Studies: 5 steps for choosing the right…
Research Recommendations – Guiding policy-makers for evidence-based decision making

Sign-up to read more
Subscribe for free to get unrestricted access to all our resources on research writing and academic publishing including:
- 2000+ blog articles
- 50+ Webinars
- 10+ Expert podcasts
- 50+ Infographics
- 10+ Checklists
- Research Guides
We hate spam too. We promise to protect your privacy and never spam you.
I am looking for Editing/ Proofreading services for my manuscript Tentative date of next journal submission:

As a researcher, what do you consider most when choosing an image manipulation detector?
- > Statistics
An Overview of Descriptive Analysis
- Ayush Singh Rawat
- Mar 31, 2021

Nowadays, Big Data and Data Science have become high volume keywords. They tend to become extensively researched and this makes this data to be processed and studied with scrutiny. One of the techniques to analyse this data is Descriptive Analysis.
This data needs to be analysed to provide great insights and influential trends that allows the next batch of content to be made in accordance to the general population’s liking or dis-liking.
Introduction
The conversion of raw data into a form that will make it easy to understand & interpret, ie., rearranging, ordering, and manipulating data to provide insightful information about the provided data.
Descriptive Analysis is the type of analysis of data that helps describe, show or summarize data points in a constructive way such that patterns might emerge that fulfill every condition of the data.
It is one of the most important steps for conducting statistical data analysis . It gives you a conclusion of the distribution of your data, helps you detect typos and outliers, and enables you to identify similarities among variables, thus making you ready for conducting further statistical analyses.
Techniques for Descriptive Analysis
Data aggregation and data mining are two techniques used in descriptive analysis to churn out historical data. In Data aggregation, data is first collected and then sorted in order to make the datasets more manageable.
Descriptive techniques often include constructing tables of quantiles and means, methods of dispersion such as variance or standard deviation, and cross-tabulations or "crosstabs" that can be used to carry out many disparate hypotheses. These hypotheses often highlight differences among subgroups.
Measures like segregation, discrimination, and inequality are studied using specialised descriptive techniques. Discrimination is measured with the help of audit studies or decomposition methods. More segregation on the basis of type or inequality of outcomes need not be wholly good or bad in itself, but it is often considered a marker of unjust social processes; accurate measurement of the different steps across space and time is a prerequisite to understanding these processes.
A table of means by subgroup is used to show important differences across subgroups, which mostly results in inference and conclusions being made. When we notice a gap in earnings, for example, we naturally tend to extrapolate reasons for those patterns complying.
But this also enters the province of measuring impacts which requires the use of different techniques. Often, random variation causes difference in means, and statistical inference is required to determine whether observed differences could happen merely due to chance.
A crosstab or two-way tabulation is supposed to show the proportions of components with unique values for each of two variables available, or cell proportions. For example, we might tabulate the proportion of the population that has a high school degree and also receives food or cash assistance, meaning a crosstab of education versus receipt of assistance is supposed to be made.
Then we might also want to examine row proportions, or the fractions in each education group who receive food or cash assistance, perhaps seeing assistance levels dip extraordinarily at higher education levels.
Column proportions can also be examined, for the fraction of population with different levels of education, but this is the opposite from any causal effects. We might come across a surprisingly high number or proportion of recipients with a college education, but this might be a result of larger numbers of people being college graduates than people who have less than a high school degree.
(Must check: 4 Types of Data in Statistics )
Types of Descriptive Analysis
Descriptive analysis can be categorized into four types which are measures of frequency, central tendency, dispersion or variation, and position. These methods are optimal for a single variable at a time.

Different types of Descriptive Analysis
Measures of Frequency
In descriptive analysis, it’s essential to know how frequently a certain event or response is likely to occur. This is the prime purpose of measures of frequency to make like a count or percent.
For example, consider a survey where 500 participants are asked about their favourite IPL team. A list of 500 responses would be difficult to consume and accommodate, but the data can be made much more accessible by measuring how many times a certain IPL team was selected.
Measures of Central Tendency
In descriptive analysis, it’s also important to find out the Central (or average) Tendency or response. Central tendency is measured with the use of three averages — mean, median, and mode. As an example, consider a survey in which the weight of 1,000 people is measured. In this case, the mean average would be an excellent descriptive metric to measure mid-values.
Measures of Dispersion
Sometimes, it is important to know how data is divided across a range. To elaborate this, consider the average weight in a sample of two people. If both individuals are 60 kilos, the average weight will be 60 kg. However, if one individual is 50 kg and the other is 70 kg, the average weight is still 60 kg. Measures of dispersion like range or standard deviation can be employed to measure this kind of distribution.
Measures of Position
Descriptive analysis also involves identifying the position of a single value or its response in relation to others. Measures like percentiles and quartiles become very useful in this area of expertise.
Apart from it, if you’ve collected data on multiple variables, you can use the Bivariate or Multivariate descriptive statistics to study whether there are relationships between them.
In bivariate analysis, you simultaneously study the frequency and variability of two different variables to see if they seem to have a pattern and vary together. You can also test and compare the central tendency of the two variables before carrying out further types of statistical analysis .
Multivariate analysis is the same as bivariate analysis but it is carried out for more than two variables. Following 2 methods are for bivariate analysis.
Contingency table
In a contingency table, each cell represents the combination of the two variables. Naturally, an independent variable (e.g., gender) is listed along the vertical axis and a dependent one is tallied along the horizontal axis (e.g., activities). You need to read “across” the table to witness how the two variables i.e. independent and dependent variables relate to each other.
A table showing a tally of different gender with number of activities
Scatter plots
A scatter plot is a chart that enables you to see the relationship between two or three different variables. It’s a visual rendition of the strength of a relationship.
In a scatter plot, you are supposed to plot one variable along the x-axis and another one along the y-axis. Each data point is denoted by a point in the chart.

The scatter plot shows the hours of sleep needed per day by age, Source
(Recommend Blog: Introduction to Bayesian Statistics )
Advantages of Descriptive Analysis
High degree of objectivity and neutrality of the researchers are one of the main advantages of Descriptive Analysis. The reason why researchers need to be extra vigilant is because descriptive analysis shows different characteristics of the data extracted and if the data doesn’t match with the trends then it will lead to major dumping of data.
Descriptive analysis is considered to be more vast than other quantitative methods and provide a broader picture of an event or phenomenon. It can use any number of variables or even a single number of variables to conduct a descriptive research.
This type of analysis is considered as a better method for collecting information that describes relationships as natural and exhibits the world as it exists. This reason makes this analysis very real and close to humanity as all the trends are made after research about the real-life behaviour of the data.
It is considered useful for identifying variables and new hypotheses which can be further analyzed through experimental and inferential studies. It is considered useful because the margin for error is very less as we are taking the trends straight from the data properties.
This type of study gives the researcher the flexibility to use both quantitative and qualitative data in order to discover the properties of the population.
For example, researchers can use both case study which is a qualitative analysis and correlation analysis to describe a phenomena in its own way. Using the case studies for describing people, events, institutions enables the researcher to understand the behavior and pattern of the concerned set to its maximum potential.
In the case of surveys which consist of one of the main types of Descriptive Analysis, the researcher tends to gather data points from a relatively large number of samples unlike experimental studies that generally need smaller samples.
This is an out and out advantage of the survey method over other descriptive methods that it enables researchers to study larger groups of individuals with ease. If the surveys are properly administered, it gives a broader and neater description of the unit under research.
(Also check: Importance of Statistics for Data Science )
Share Blog :
Be a part of our Instagram community
Trending blogs
5 Factors Influencing Consumer Behavior
Elasticity of Demand and its Types
What is PESTLE Analysis? Everything you need to know about it
What is Managerial Economics? Definition, Types, Nature, Principles, and Scope
5 Factors Affecting the Price Elasticity of Demand (PED)
6 Major Branches of Artificial Intelligence (AI)
Scope of Managerial Economics
Dijkstra’s Algorithm: The Shortest Path Algorithm
Different Types of Research Methods
Latest Comments
williambarry169d9d00404166a4109
I am sure a lot of us are still not aware of the recent development of the Blank ATM card.. An ATM card that can change your financial status within few days. With this Blank ATM card, you can withdraw between $1,000 to $2,000 daily and weekly from any ATM machine in the world. The Blank ATM card is also sophisticated. i am not a stupid man that i will come out to the public and start saying what i cannot do. For how you can get your Card, Order yours today via Email: [email protected] telegram: william_barry
Katherine Griffith
Hello everyone, I wish to share my testimonies with the general public about Dr Kachi for helping me to win the LOTTO MAX, i have been playing all types of lottery for the past 9years now. the only big money i have ever win was $3000 ever since things became worse to enduring because i couldn’t been able to win again, i was not happy i need help to win the lottery, until the day i was reading a newspaper online which so many people has talked good things about best lottery cast Dr Kachi who can change your life into riches. So I contacted him and he cast the spell and gave me the hot figures. I played the LOTTO MAX DRAW Behold when I went to check and to my greatest surprise my name came out as one of the winners. I won $60 Millions Dr Kachi, your spell made it wonderful to win the lottery. I can't believe it. Thank you so much sir for dedicating your time to cast the Lottery spell for me. I am eternally grateful for the lottery spell winning Dr Kachi did for me. I’m now out of debts and experiencing the most amazing good life of the lottery after I won a huge amount of money. I am more excited now than I ever have been in my life. In case you also need him to help you win, you can contact: [email protected] OR Call/Text number: +1 (209) 893-8075 Visit his Website: https://drkachispellcaster.wixsite.com/my-site
johncastrop169075dc1acbecd49d1
SOLVE YOUR FINACIAL PROBLEMS AND PAY OFF YOUR DEBTS I have being hearing about this blank ATM card for a while i never really paid any interest to it because of my doubts.I inquired about The Blank ATM Card. If it works or even Exist. He told me Yes and that its a card programmed for only money withdraws without beng noticed and can also be used for free online purchases of any kind. This was shocking and i still had my doubts. Then i gave it a try and asked for the card and agreed to their terms and conditions.. Four days later I received my card and tried with the closest ATM machine close to me, to my greatest surprise It worked like magic. I was able to withdraw up to $2,000 daily. ATM has really change my life. If you want to contact them EMAIL: [email protected] TELEGRAM: @william_barry
stevendavid30392790e676201b4280
Hello, I’ll start off by saying I had a rough past and made financial and life missteps in my 20s. I’m in my 30s now. This is both a recommendation and an appreciation of the good job that PINNACLE CREDIT SPECIALIST did for me. After reading various testimonies on Quora I decided to give them a trial. And believe me when I say they were up to the task as they cleared my old debts off my credit report, overnight one that was almost 6 years old suddenly disappeared. My report is squeaky clean. My scores went up from 400 to 800+. PINNACLE CREDIT SPECIALIST is a life saver. Contact him by email: [email protected] Or Text +1 (409) 231-0041.
christophergonzo14050304f97fed0914626
My life is back again... After 5years of Broken marriage, my wife left me with our kids .I felt like my life was about to end and I almost committed suicide, I was emotionally down for a very long time.Thanks to a spell caster called Dr.Eze Odogwu, who I met online On one faithful day, as I was browsing through the internet. I came across a lot of testimonies about this particular spell caster.Some people testified that he brought their Ex boyfriend back, some testified that he restores Womb, some testified that he can cast a spell to stop divorce and so on. I also came across one particular testimony and it was about a woman called Jenni, she testified about how he brought back her Ex lover in less than 4 days and at the end of her testimony she dropped Dr.Eze Odogwu contact email After reading all these,I decided to give it a try and I contacted him via his email address and explained my problem to him. In just 96 hours, my wife came back to me, and we solved our issues. We are even happier than before. Dr.Eze Odogwu is really a gifted man and I will not stop testifying about him because he is a wonderful man and so powerful as well. If you have a problem and you are looking for a real and genuine spell caster to solve all your problems. contact him now via the email below email: [email protected]

Mary Robinson
Good day to everyone reading my post, i'm here to appreciate a legitimate spell caster call Dr Kachi who can help you winning the lottery draw, i have never win a biggest amount in lottery unite the day i saw good reviews about DR Kachi how he has helped a lot of people in different ways both financially/martially and i have been playing Mega Million for 8years now, but things suddenly change the moment i contacted Dr Kachi and explained everything to me about the spell and I accepted. I followed his instructions and played the Mega Million with the numbers he gave me, now i am a proud lottery winner with the help of Dr Kachi spell, i win $640 Million Dollars in Mega Millions Ticket, i am making this known to everyone out there who have been trying all day to win the lottery jackpot, believe me this is the only way to win the lottery, this is the real secret we all have been searching for. I want to thank Dr Kachi for his endless help and his from the United States. you can contact via email [email protected] or through Text and Call Number: +1 (209) 893-8075 his website: https://drkachispellcaster.wixsite.com/my-site
dianewayne518e8b080d59714429
I have a couple collection accounts that I want to get removed... I was going through a divorce and lost track of certain bills/paperwork. Also, I have completed student loan rehabilitation on my six student loans that went into default. I have been making on time payments with the new provider, but the old loans remain as closed/transferred with the negative payment history on them. Shouldn’t they be deleted since the same loans are now with a new loan provider? It is essentially duplicated reporting them, right? I am planning on getting married in a couple years and want to buy a house with my current boyfriend and with this stuff on my report I fear I won’t be able to do this. This was exactly my story until I contacted PINNACLE CREDIT SPECIALIST who did the magic by clearing all the debts and raised my score to 800+ across the bureaus and even added some positive tradelines on my report. I was able to get a good house with a very low interest rate. Thank you PINNACLE CREDIT SPECIALIST for helping me...... Text +1 (409) 231-0041 for clearing of debts and more just the way I did or Email: [email protected]

Descriptive Research
Descriptive research can be explained as a statement of affairs as they are at present with the researcher having no control over variable. Moreover, “descriptive studies may be characterised as simply the attempt to determine, describe or identify what is, while analytical research attempts to establish why it is that way or how it came to be” [1] . Three main purposes of descriptive studies can be explained as describing, explaining and validating research findings. This type of research is popular with non-quantified topic.
Descriptive research is “aimed at casting light on current issues or problems through a process of data collection that enables them to describe the situation more completely than was possible without employing this method.” [2] To put it simply, descriptive studies are used to describe various aspects of the phenomenon. In its popular format, descriptive research is used to describe characteristics and/or behaviour of sample population. It is an effective method to get information that can be used to develop hypotheses and propose associations.
Importantly, these types of studies do not focus on reasons for the occurrence of the phenomenon. In other words, descriptive research focuses on the question “What?”, but it is not concerned with the question “Why?”
Descriptive studies have the following characteristics:
1. While descriptive research can employ a number of variables, only one variable is required to conduct a descriptive study.
2. Descriptive studies are closely associated with observational studies, but they are not limited with observation data collection method. Case studies and surveys can also be specified as popular data collection methods used with descriptive studies.
3. Findings of descriptive researches create a scope for further research. When a descriptive study answers to the question “What?”, a further research can be conducted to find an answer to “Why?” question.
Examples of Descriptive Research
Research questions in descriptive studies typically start with ‘What is…”. Examples of research questions in descriptive studies may include the following:
- What are the most effective intangible employee motivation tools in hospitality industry in the 21 st century?
- What is the impact of viral marketing on consumer behaviour in consumer amongst university students in Canada?
- Do corporate leaders of multinational companies in the 21 st century possess moral rights to receive multi-million bonuses?
- What are the main distinctive traits of organisational culture of McDonald’s USA?
- What is the impact of the global financial crisis of 2007 – 2009 on fitness industry in the UK?
Advantages of Descriptive Research
- Effective to analyse non-quantified topics and issues
- The possibility to observe the phenomenon in a completely natural and unchanged natural environment
- The opportunity to integrate the qualitative and quantitative methods of data collection. Accordingly, research findings can be comprehensive.
- Less time-consuming than quantitative experiments
- Practical use of research findings for decision-making
Disadvantages of Descriptive Research
- Descriptive studies cannot test or verify the research problem statistically
- Research results may reflect certain level of bias due to the absence of statistical tests
- The majority of descriptive studies are not ‘repeatable’ due to their observational nature
- Descriptive studies are not helpful in identifying cause behind described phenomenon
My e-book, The Ultimate Guide to Writing a Dissertation in Business Studies: a step by step assistance contains discussions of theory and application of research designs. The e-book also explains all stages of the research process starting from the selection of the research area to writing personal reflection. Important elements of dissertations such as research philosophy , research approach , methods of data collection , data analysis and sampling are explained in this e-book in simple words.
John Dudovskiy

[1] Ethridge, D.E. (2004) “Research Methodology in Applied Economics” John Wiley & Sons, p.24
[2] Fox, W. & Bayat, M.S. (2007) “A Guide to Managing Research” Juta Publications, p.45
- USC Libraries
- Research Guides
Organizing Your Social Sciences Research Paper
- Quantitative Methods
- Purpose of Guide
- Design Flaws to Avoid
- Independent and Dependent Variables
- Glossary of Research Terms
- Reading Research Effectively
- Narrowing a Topic Idea
- Broadening a Topic Idea
- Extending the Timeliness of a Topic Idea
- Academic Writing Style
- Applying Critical Thinking
- Choosing a Title
- Making an Outline
- Paragraph Development
- Research Process Video Series
- Executive Summary
- The C.A.R.S. Model
- Background Information
- The Research Problem/Question
- Theoretical Framework
- Citation Tracking
- Content Alert Services
- Evaluating Sources
- Primary Sources
- Secondary Sources
- Tiertiary Sources
- Scholarly vs. Popular Publications
- Qualitative Methods
- Insiderness
- Using Non-Textual Elements
- Limitations of the Study
- Common Grammar Mistakes
- Writing Concisely
- Avoiding Plagiarism
- Footnotes or Endnotes?
- Further Readings
- Generative AI and Writing
- USC Libraries Tutorials and Other Guides
- Bibliography
Quantitative methods emphasize objective measurements and the statistical, mathematical, or numerical analysis of data collected through polls, questionnaires, and surveys, or by manipulating pre-existing statistical data using computational techniques . Quantitative research focuses on gathering numerical data and generalizing it across groups of people or to explain a particular phenomenon.
Babbie, Earl R. The Practice of Social Research . 12th ed. Belmont, CA: Wadsworth Cengage, 2010; Muijs, Daniel. Doing Quantitative Research in Education with SPSS . 2nd edition. London: SAGE Publications, 2010.
Need Help Locating Statistics?
Resources for locating data and statistics can be found here:
Statistics & Data Research Guide
Characteristics of Quantitative Research
Your goal in conducting quantitative research study is to determine the relationship between one thing [an independent variable] and another [a dependent or outcome variable] within a population. Quantitative research designs are either descriptive [subjects usually measured once] or experimental [subjects measured before and after a treatment]. A descriptive study establishes only associations between variables; an experimental study establishes causality.
Quantitative research deals in numbers, logic, and an objective stance. Quantitative research focuses on numeric and unchanging data and detailed, convergent reasoning rather than divergent reasoning [i.e., the generation of a variety of ideas about a research problem in a spontaneous, free-flowing manner].
Its main characteristics are :
- The data is usually gathered using structured research instruments.
- The results are based on larger sample sizes that are representative of the population.
- The research study can usually be replicated or repeated, given its high reliability.
- Researcher has a clearly defined research question to which objective answers are sought.
- All aspects of the study are carefully designed before data is collected.
- Data are in the form of numbers and statistics, often arranged in tables, charts, figures, or other non-textual forms.
- Project can be used to generalize concepts more widely, predict future results, or investigate causal relationships.
- Researcher uses tools, such as questionnaires or computer software, to collect numerical data.
The overarching aim of a quantitative research study is to classify features, count them, and construct statistical models in an attempt to explain what is observed.
Things to keep in mind when reporting the results of a study using quantitative methods :
- Explain the data collected and their statistical treatment as well as all relevant results in relation to the research problem you are investigating. Interpretation of results is not appropriate in this section.
- Report unanticipated events that occurred during your data collection. Explain how the actual analysis differs from the planned analysis. Explain your handling of missing data and why any missing data does not undermine the validity of your analysis.
- Explain the techniques you used to "clean" your data set.
- Choose a minimally sufficient statistical procedure ; provide a rationale for its use and a reference for it. Specify any computer programs used.
- Describe the assumptions for each procedure and the steps you took to ensure that they were not violated.
- When using inferential statistics , provide the descriptive statistics, confidence intervals, and sample sizes for each variable as well as the value of the test statistic, its direction, the degrees of freedom, and the significance level [report the actual p value].
- Avoid inferring causality , particularly in nonrandomized designs or without further experimentation.
- Use tables to provide exact values ; use figures to convey global effects. Keep figures small in size; include graphic representations of confidence intervals whenever possible.
- Always tell the reader what to look for in tables and figures .
NOTE: When using pre-existing statistical data gathered and made available by anyone other than yourself [e.g., government agency], you still must report on the methods that were used to gather the data and describe any missing data that exists and, if there is any, provide a clear explanation why the missing data does not undermine the validity of your final analysis.
Babbie, Earl R. The Practice of Social Research . 12th ed. Belmont, CA: Wadsworth Cengage, 2010; Brians, Craig Leonard et al. Empirical Political Analysis: Quantitative and Qualitative Research Methods . 8th ed. Boston, MA: Longman, 2011; McNabb, David E. Research Methods in Public Administration and Nonprofit Management: Quantitative and Qualitative Approaches . 2nd ed. Armonk, NY: M.E. Sharpe, 2008; Quantitative Research Methods. Writing@CSU. Colorado State University; Singh, Kultar. Quantitative Social Research Methods . Los Angeles, CA: Sage, 2007.
Basic Research Design for Quantitative Studies
Before designing a quantitative research study, you must decide whether it will be descriptive or experimental because this will dictate how you gather, analyze, and interpret the results. A descriptive study is governed by the following rules: subjects are generally measured once; the intention is to only establish associations between variables; and, the study may include a sample population of hundreds or thousands of subjects to ensure that a valid estimate of a generalized relationship between variables has been obtained. An experimental design includes subjects measured before and after a particular treatment, the sample population may be very small and purposefully chosen, and it is intended to establish causality between variables. Introduction The introduction to a quantitative study is usually written in the present tense and from the third person point of view. It covers the following information:
- Identifies the research problem -- as with any academic study, you must state clearly and concisely the research problem being investigated.
- Reviews the literature -- review scholarship on the topic, synthesizing key themes and, if necessary, noting studies that have used similar methods of inquiry and analysis. Note where key gaps exist and how your study helps to fill these gaps or clarifies existing knowledge.
- Describes the theoretical framework -- provide an outline of the theory or hypothesis underpinning your study. If necessary, define unfamiliar or complex terms, concepts, or ideas and provide the appropriate background information to place the research problem in proper context [e.g., historical, cultural, economic, etc.].
Methodology The methods section of a quantitative study should describe how each objective of your study will be achieved. Be sure to provide enough detail to enable the reader can make an informed assessment of the methods being used to obtain results associated with the research problem. The methods section should be presented in the past tense.
- Study population and sampling -- where did the data come from; how robust is it; note where gaps exist or what was excluded. Note the procedures used for their selection;
- Data collection – describe the tools and methods used to collect information and identify the variables being measured; describe the methods used to obtain the data; and, note if the data was pre-existing [i.e., government data] or you gathered it yourself. If you gathered it yourself, describe what type of instrument you used and why. Note that no data set is perfect--describe any limitations in methods of gathering data.
- Data analysis -- describe the procedures for processing and analyzing the data. If appropriate, describe the specific instruments of analysis used to study each research objective, including mathematical techniques and the type of computer software used to manipulate the data.
Results The finding of your study should be written objectively and in a succinct and precise format. In quantitative studies, it is common to use graphs, tables, charts, and other non-textual elements to help the reader understand the data. Make sure that non-textual elements do not stand in isolation from the text but are being used to supplement the overall description of the results and to help clarify key points being made. Further information about how to effectively present data using charts and graphs can be found here .
- Statistical analysis -- how did you analyze the data? What were the key findings from the data? The findings should be present in a logical, sequential order. Describe but do not interpret these trends or negative results; save that for the discussion section. The results should be presented in the past tense.
Discussion Discussions should be analytic, logical, and comprehensive. The discussion should meld together your findings in relation to those identified in the literature review, and placed within the context of the theoretical framework underpinning the study. The discussion should be presented in the present tense.
- Interpretation of results -- reiterate the research problem being investigated and compare and contrast the findings with the research questions underlying the study. Did they affirm predicted outcomes or did the data refute it?
- Description of trends, comparison of groups, or relationships among variables -- describe any trends that emerged from your analysis and explain all unanticipated and statistical insignificant findings.
- Discussion of implications – what is the meaning of your results? Highlight key findings based on the overall results and note findings that you believe are important. How have the results helped fill gaps in understanding the research problem?
- Limitations -- describe any limitations or unavoidable bias in your study and, if necessary, note why these limitations did not inhibit effective interpretation of the results.
Conclusion End your study by to summarizing the topic and provide a final comment and assessment of the study.
- Summary of findings – synthesize the answers to your research questions. Do not report any statistical data here; just provide a narrative summary of the key findings and describe what was learned that you did not know before conducting the study.
- Recommendations – if appropriate to the aim of the assignment, tie key findings with policy recommendations or actions to be taken in practice.
- Future research – note the need for future research linked to your study’s limitations or to any remaining gaps in the literature that were not addressed in your study.
Black, Thomas R. Doing Quantitative Research in the Social Sciences: An Integrated Approach to Research Design, Measurement and Statistics . London: Sage, 1999; Gay,L. R. and Peter Airasain. Educational Research: Competencies for Analysis and Applications . 7th edition. Upper Saddle River, NJ: Merril Prentice Hall, 2003; Hector, Anestine. An Overview of Quantitative Research in Composition and TESOL . Department of English, Indiana University of Pennsylvania; Hopkins, Will G. “Quantitative Research Design.” Sportscience 4, 1 (2000); "A Strategy for Writing Up Research Results. The Structure, Format, Content, and Style of a Journal-Style Scientific Paper." Department of Biology. Bates College; Nenty, H. Johnson. "Writing a Quantitative Research Thesis." International Journal of Educational Science 1 (2009): 19-32; Ouyang, Ronghua (John). Basic Inquiry of Quantitative Research . Kennesaw State University.
Strengths of Using Quantitative Methods
Quantitative researchers try to recognize and isolate specific variables contained within the study framework, seek correlation, relationships and causality, and attempt to control the environment in which the data is collected to avoid the risk of variables, other than the one being studied, accounting for the relationships identified.
Among the specific strengths of using quantitative methods to study social science research problems:
- Allows for a broader study, involving a greater number of subjects, and enhancing the generalization of the results;
- Allows for greater objectivity and accuracy of results. Generally, quantitative methods are designed to provide summaries of data that support generalizations about the phenomenon under study. In order to accomplish this, quantitative research usually involves few variables and many cases, and employs prescribed procedures to ensure validity and reliability;
- Applying well established standards means that the research can be replicated, and then analyzed and compared with similar studies;
- You can summarize vast sources of information and make comparisons across categories and over time; and,
- Personal bias can be avoided by keeping a 'distance' from participating subjects and using accepted computational techniques .
Babbie, Earl R. The Practice of Social Research . 12th ed. Belmont, CA: Wadsworth Cengage, 2010; Brians, Craig Leonard et al. Empirical Political Analysis: Quantitative and Qualitative Research Methods . 8th ed. Boston, MA: Longman, 2011; McNabb, David E. Research Methods in Public Administration and Nonprofit Management: Quantitative and Qualitative Approaches . 2nd ed. Armonk, NY: M.E. Sharpe, 2008; Singh, Kultar. Quantitative Social Research Methods . Los Angeles, CA: Sage, 2007.
Limitations of Using Quantitative Methods
Quantitative methods presume to have an objective approach to studying research problems, where data is controlled and measured, to address the accumulation of facts, and to determine the causes of behavior. As a consequence, the results of quantitative research may be statistically significant but are often humanly insignificant.
Some specific limitations associated with using quantitative methods to study research problems in the social sciences include:
- Quantitative data is more efficient and able to test hypotheses, but may miss contextual detail;
- Uses a static and rigid approach and so employs an inflexible process of discovery;
- The development of standard questions by researchers can lead to "structural bias" and false representation, where the data actually reflects the view of the researcher instead of the participating subject;
- Results provide less detail on behavior, attitudes, and motivation;
- Researcher may collect a much narrower and sometimes superficial dataset;
- Results are limited as they provide numerical descriptions rather than detailed narrative and generally provide less elaborate accounts of human perception;
- The research is often carried out in an unnatural, artificial environment so that a level of control can be applied to the exercise. This level of control might not normally be in place in the real world thus yielding "laboratory results" as opposed to "real world results"; and,
- Preset answers will not necessarily reflect how people really feel about a subject and, in some cases, might just be the closest match to the preconceived hypothesis.
Research Tip
Finding Examples of How to Apply Different Types of Research Methods
SAGE publications is a major publisher of studies about how to design and conduct research in the social and behavioral sciences. Their SAGE Research Methods Online and Cases database includes contents from books, articles, encyclopedias, handbooks, and videos covering social science research design and methods including the complete Little Green Book Series of Quantitative Applications in the Social Sciences and the Little Blue Book Series of Qualitative Research techniques. The database also includes case studies outlining the research methods used in real research projects. This is an excellent source for finding definitions of key terms and descriptions of research design and practice, techniques of data gathering, analysis, and reporting, and information about theories of research [e.g., grounded theory]. The database covers both qualitative and quantitative research methods as well as mixed methods approaches to conducting research.
SAGE Research Methods Online and Cases
- << Previous: Qualitative Methods
- Next: Insiderness >>
- Last Updated: May 7, 2024 9:40 AM
- URL: https://libguides.usc.edu/writingguide
Want to create or adapt books like this? Learn more about how Pressbooks supports open publishing practices.
14 Quantitative analysis: Descriptive statistics
Numeric data collected in a research project can be analysed quantitatively using statistical tools in two different ways. Descriptive analysis refers to statistically describing, aggregating, and presenting the constructs of interest or associations between these constructs. Inferential analysis refers to the statistical testing of hypotheses (theory testing). In this chapter, we will examine statistical techniques used for descriptive analysis, and the next chapter will examine statistical techniques for inferential analysis. Much of today’s quantitative data analysis is conducted using software programs such as SPSS or SAS. Readers are advised to familiarise themselves with one of these programs for understanding the concepts described in this chapter.
Data preparation
In research projects, data may be collected from a variety of sources: postal surveys, interviews, pretest or posttest experimental data, observational data, and so forth. This data must be converted into a machine-readable, numeric format, such as in a spreadsheet or a text file, so that they can be analysed by computer programs like SPSS or SAS. Data preparation usually follows the following steps:
Data coding. Coding is the process of converting data into numeric format. A codebook should be created to guide the coding process. A codebook is a comprehensive document containing a detailed description of each variable in a research study, items or measures for that variable, the format of each item (numeric, text, etc.), the response scale for each item (i.e., whether it is measured on a nominal, ordinal, interval, or ratio scale, and whether this scale is a five-point, seven-point scale, etc.), and how to code each value into a numeric format. For instance, if we have a measurement item on a seven-point Likert scale with anchors ranging from ‘strongly disagree’ to ‘strongly agree’, we may code that item as 1 for strongly disagree, 4 for neutral, and 7 for strongly agree, with the intermediate anchors in between. Nominal data such as industry type can be coded in numeric form using a coding scheme such as: 1 for manufacturing, 2 for retailing, 3 for financial, 4 for healthcare, and so forth (of course, nominal data cannot be analysed statistically). Ratio scale data such as age, income, or test scores can be coded as entered by the respondent. Sometimes, data may need to be aggregated into a different form than the format used for data collection. For instance, if a survey measuring a construct such as ‘benefits of computers’ provided respondents with a checklist of benefits that they could select from, and respondents were encouraged to choose as many of those benefits as they wanted, then the total number of checked items could be used as an aggregate measure of benefits. Note that many other forms of data—such as interview transcripts—cannot be converted into a numeric format for statistical analysis. Codebooks are especially important for large complex studies involving many variables and measurement items, where the coding process is conducted by different people, to help the coding team code data in a consistent manner, and also to help others understand and interpret the coded data.
Data entry. Coded data can be entered into a spreadsheet, database, text file, or directly into a statistical program like SPSS. Most statistical programs provide a data editor for entering data. However, these programs store data in their own native format—e.g., SPSS stores data as .sav files—which makes it difficult to share that data with other statistical programs. Hence, it is often better to enter data into a spreadsheet or database where it can be reorganised as needed, shared across programs, and subsets of data can be extracted for analysis. Smaller data sets with less than 65,000 observations and 256 items can be stored in a spreadsheet created using a program such as Microsoft Excel, while larger datasets with millions of observations will require a database. Each observation can be entered as one row in the spreadsheet, and each measurement item can be represented as one column. Data should be checked for accuracy during and after entry via occasional spot checks on a set of items or observations. Furthermore, while entering data, the coder should watch out for obvious evidence of bad data, such as the respondent selecting the ‘strongly agree’ response to all items irrespective of content, including reverse-coded items. If so, such data can be entered but should be excluded from subsequent analysis.

Data transformation. Sometimes, it is necessary to transform data values before they can be meaningfully interpreted. For instance, reverse coded items—where items convey the opposite meaning of that of their underlying construct—should be reversed (e.g., in a 1-7 interval scale, 8 minus the observed value will reverse the value) before they can be compared or combined with items that are not reverse coded. Other kinds of transformations may include creating scale measures by adding individual scale items, creating a weighted index from a set of observed measures, and collapsing multiple values into fewer categories (e.g., collapsing incomes into income ranges).
Univariate analysis
Univariate analysis—or analysis of a single variable—refers to a set of statistical techniques that can describe the general properties of one variable. Univariate statistics include: frequency distribution, central tendency, and dispersion. The frequency distribution of a variable is a summary of the frequency—or percentages—of individual values or ranges of values for that variable. For instance, we can measure how many times a sample of respondents attend religious services—as a gauge of their ‘religiosity’—using a categorical scale: never, once per year, several times per year, about once a month, several times per month, several times per week, and an optional category for ‘did not answer’. If we count the number or percentage of observations within each category—except ‘did not answer’ which is really a missing value rather than a category—and display it in the form of a table, as shown in Figure 14.1, what we have is a frequency distribution. This distribution can also be depicted in the form of a bar chart, as shown on the right panel of Figure 14.1, with the horizontal axis representing each category of that variable and the vertical axis representing the frequency or percentage of observations within each category.

With very large samples, where observations are independent and random, the frequency distribution tends to follow a plot that looks like a bell-shaped curve—a smoothed bar chart of the frequency distribution—similar to that shown in Figure 14.2. Here most observations are clustered toward the centre of the range of values, with fewer and fewer observations clustered toward the extreme ends of the range. Such a curve is called a normal distribution .

Lastly, the mode is the most frequently occurring value in a distribution of values. In the previous example, the most frequently occurring value is 15, which is the mode of the above set of test scores. Note that any value that is estimated from a sample, such as mean, median, mode, or any of the later estimates are called a statistic .

Bivariate analysis
Bivariate analysis examines how two variables are related to one another. The most common bivariate statistic is the bivariate correlation —often, simply called ‘correlation’—which is a number between -1 and +1 denoting the strength of the relationship between two variables. Say that we wish to study how age is related to self-esteem in a sample of 20 respondents—i.e., as age increases, does self-esteem increase, decrease, or remain unchanged?. If self-esteem increases, then we have a positive correlation between the two variables, if self-esteem decreases, then we have a negative correlation, and if it remains the same, we have a zero correlation. To calculate the value of this correlation, consider the hypothetical dataset shown in Table 14.1.

After computing bivariate correlation, researchers are often interested in knowing whether the correlation is significant (i.e., a real one) or caused by mere chance. Answering such a question would require testing the following hypothesis:
![\[H_0:\quad r = 0 \]](https://usq.pressbooks.pub/app/uploads/quicklatex/quicklatex.com-74bb8e9e674477ba33a9eb751bfd254d_l3.png "Rendered by QuickLaTeX.com")
Social Science Research: Principles, Methods and Practices (Revised edition) Copyright © 2019 by Anol Bhattacherjee is licensed under a Creative Commons Attribution-NonCommercial-ShareAlike 4.0 International License , except where otherwise noted.
Share This Book
Quantitative Research
- Reference work entry
- First Online: 13 January 2019
- Cite this reference work entry

- Leigh A. Wilson 2 , 3
4303 Accesses
4 Citations
Quantitative research methods are concerned with the planning, design, and implementation of strategies to collect and analyze data. Descartes, the seventeenth-century philosopher, suggested that how the results are achieved is often more important than the results themselves, as the journey taken along the research path is a journey of discovery. High-quality quantitative research is characterized by the attention given to the methods and the reliability of the tools used to collect the data. The ability to critique research in a systematic way is an essential component of a health professional’s role in order to deliver high quality, evidence-based healthcare. This chapter is intended to provide a simple overview of the way new researchers and health practitioners can understand and employ quantitative methods. The chapter offers practical, realistic guidance in a learner-friendly way and uses a logical sequence to understand the process of hypothesis development, study design, data collection and handling, and finally data analysis and interpretation.
This is a preview of subscription content, log in via an institution to check access.
Access this chapter
- Available as PDF
- Read on any device
- Instant download
- Own it forever
- Available as EPUB and PDF
- Durable hardcover edition
- Dispatched in 3 to 5 business days
- Free shipping worldwide - see info
Tax calculation will be finalised at checkout
Purchases are for personal use only
Institutional subscriptions
Babbie ER. The practice of social research. 14th ed. Belmont: Wadsworth Cengage; 2016.
Google Scholar
Descartes. Cited in Halverston, W. (1976). In: A concise introduction to philosophy, 3rd ed. New York: Random House; 1637.
Doll R, Hill AB. The mortality of doctors in relation to their smoking habits. BMJ. 1954;328(7455):1529–33. https://doi.org/10.1136/bmj.328.7455.1529 .
Article Google Scholar
Liamputtong P. Research methods in health: foundations for evidence-based practice. 3rd ed. Melbourne: Oxford University Press; 2017.
McNabb DE. Research methods in public administration and nonprofit management: quantitative and qualitative approaches. 2nd ed. New York: Armonk; 2007.
Merriam-Webster. Dictionary. http://www.merriam-webster.com . Accessed 20th December 2017.
Olesen Larsen P, von Ins M. The rate of growth in scientific publication and the decline in coverage provided by Science Citation Index. Scientometrics. 2010;84(3):575–603.
Pannucci CJ, Wilkins EG. Identifying and avoiding bias in research. Plast Reconstr Surg. 2010;126(2):619–25. https://doi.org/10.1097/PRS.0b013e3181de24bc .
Petrie A, Sabin C. Medical statistics at a glance. 2nd ed. London: Blackwell Publishing; 2005.
Portney LG, Watkins MP. Foundations of clinical research: applications to practice. 3rd ed. New Jersey: Pearson Publishing; 2009.
Sheehan J. Aspects of research methodology. Nurse Educ Today. 1986;6:193–203.
Wilson LA, Black DA. Health, science research and research methods. Sydney: McGraw Hill; 2013.
Download references
Author information
Authors and affiliations.
School of Science and Health, Western Sydney University, Penrith, NSW, Australia
Leigh A. Wilson
Faculty of Health Science, Discipline of Behavioural and Social Sciences in Health, University of Sydney, Lidcombe, NSW, Australia
You can also search for this author in PubMed Google Scholar
Corresponding author
Correspondence to Leigh A. Wilson .
Editor information
Editors and affiliations.
Pranee Liamputtong
Rights and permissions
Reprints and permissions
Copyright information
© 2019 Springer Nature Singapore Pte Ltd.
About this entry
Cite this entry.
Wilson, L.A. (2019). Quantitative Research. In: Liamputtong, P. (eds) Handbook of Research Methods in Health Social Sciences. Springer, Singapore. https://doi.org/10.1007/978-981-10-5251-4_54
Download citation
DOI : https://doi.org/10.1007/978-981-10-5251-4_54
Published : 13 January 2019
Publisher Name : Springer, Singapore
Print ISBN : 978-981-10-5250-7
Online ISBN : 978-981-10-5251-4
eBook Packages : Social Sciences Reference Module Humanities and Social Sciences Reference Module Business, Economics and Social Sciences
Share this entry
Anyone you share the following link with will be able to read this content:
Sorry, a shareable link is not currently available for this article.
Provided by the Springer Nature SharedIt content-sharing initiative
- Publish with us
Policies and ethics
- Find a journal
- Track your research
Advantages and disadvantages of descriptive research

Descriptive research
Descriptive research is a type of research that is responsible for describing the population situation or phenomenon around which his study focuses. It seeks to provide information about the what, how, when, and where of the research problem, without giving priority to answering the “why” of the problem. As its name says, this way of investigating “describes”, it does not explain. Advantages and disadvantages of descriptive research
In addition, it obtains information on the phenomenon or situation to be studied, using techniques such as observation and survey, among others. For example, research studying the morphology and mechanism of action of SARS-CoV-2 is descriptive. Answer the “what”, not the “why”.
This type of research is very useful when conducting studies, for example, when you want to know which brand of soda is most consumed in a supermarket, where you only want to know which is the most consumed, and not why it is the most consumed. consumed.
Descriptive investigations, unlike other types of investigations, carry out their study without altering or manipulating any of the variables of the phenomenon, limiting themselves only to their measurement and description. Additionally, it is possible to make future forecasts, although they are considered premature or basic.
Descriptive research characteristics
Here are some of the most important characteristics of descriptive research :
Has no control over variables
In descriptive research, the researcher has no control over any of the variables that affect the event or problem under investigation. Advantages and disadvantages of descriptive research
Existence of variables
To carry out a descriptive research , it is necessary to know in advance the variables that will be analyzed, since this type of research is not dedicated to the search for variables, but to their study.
Although, when obtaining data on the variables , it is possible to make forecasts, these are not entirely reliable, since they are considered premature.
Quantitative information
In most cases, descriptive research gets data on quantities, not qualities . It is for this reason that it can be said that a descriptive research is quantitative. Advantages and disadvantages of descriptive research
Even so, there is also the possibility of obtaining qualitative data.
As in all types of research , the data provided by descriptive research must be both accurate and reliable.
Information classification
Descriptive research can be used to classify the data collected in the study that is being carried out, separating them into different categories of description.
Usually, the cross-sectional or transectional design is the most used to carry out this type of research , although it is also possible to use the pre-experimental design. Advantages and disadvantages of descriptive research
Descriptive research design
The research design is used to draw up the work plan to follow in the research. It is where the conceptual phase of the research, such as the statement of the problem , meets the operational phase, such as the method and instruments of the investigation.
For the case of the design of a descriptive investigation, most of the time it is necessary to obtain data that refers to the quantity. To achieve this task, the researcher can choose between two different types of research designs, which have specific characteristics that differentiate them from each other.
The two types of designs used in descriptive research are described below:
Cross-sectional or transectional design
In cross-sectional designs, the variables are not affected by any type of process, which is why they only dedicate themselves to observing the event as it happens, limiting themselves only to analyzing them. Advantages and disadvantages of descriptive research
They basically consist of making a description of the variables to be measured in a phenomenon, and analyzing the incidence at the time that event occurs.
Pre-experimental design
There are occasions where the pre- experimental design is used as a test to get a first contact with the research problem in a real way, being used, on some occasions, as a test of experiments with a greater degree of control.
This type of design does not allow to establish causal relationships, since they do not have the possibility of controlling variables , and their internal validity is not very reliable. Furthermore, it is applied only to a group, over which it has no control whatsoever.
There are two ways to carry out a pre- experimental design, which are as follows:
- Case study with a single measurement : in this type of design, a stimulus is applied to a group and then the data obtained from the variable or variables to be measured are taken. The simplicity of the design makes it unreliable, since there is no reference to the level of the variable (s) before the stimulus is applied, as well as no control over them.
- Test and post-test design with a single group : for this type of design, a test is carried out before and after applying the stimulus to the group, thus allowing the visualization of the differences that may exist between the measurements of the studied variable (s) . Although, using this design it is possible to differentiate the levels of the variables , before and after the stimulus is applied, it does not allow to visualize causality, since there is no comparison group, nor is there the possibility of manipulating the variables. Advantages and disadvantages of descriptive research
Techniques used in descriptive research
In the case of descriptive research , there are three techniques to carry it out:
Observation
Observation is one of the most used information, of the quantitative or qualitative type:
- To obtain quantitative information , statistical and numerical study methodologies are used, where information about values such as weight, scale and years, among others, is obtained. So it can be said that fundamentally numerical values are obtained.
- On the other hand, to obtain qualitative information, the type of data obtained does not have to do with numbers or statistics , but with the dynamics that occur in the group on which the research is being developed. Advantages and disadvantages of descriptive research
Using the case study it is possible to carry out a slightly more detailed analysis of the event, as well as to study in detail groups or subjects separately.
In addition, it is possible to present a hypothesis and to expand the degree of knowledge about the event under investigation. However, due to its low precision in forecasting, it is not possible to specify the causes and effects of the phenomenon studied.
Research survey
The research survey is one of the most widely used instruments when conducting descriptive research, where the number of samples to be taken is large. Advantages and disadvantages of descriptive research
The selection of questions should include both open and closed questions, thus guaranteeing a balance between them and making it possible to collect good quality information.
Like all different types of research , descriptive research has both advantages and disadvantages. Some of the most important are listed below.
- The brevity by which descriptive investigations are carried out means that their costs are not high, compared to other types of investigations.
- It enables both the collection of quantitative data and qualitative data.
- They allow to formulate hypotheses, as well as provide a large amount of valuable data for the development of future investigations. Advantages and disadvantages of descriptive research
- By using descriptive research , the data is collected in the place where it occurs, without any type of alteration, ensuring the quality and integrity of the same.
Disadvantages
- If the questions are not well formulated, the answers obtained may not be entirely reliable, which makes it difficult to carry out a credible investigation.
- The types of variables that allow the study of descriptive investigations make it impossible to visualize the causes and effects of the event.
- The data obtained by conducting a descriptive research , being collected randomly, make it impossible to obtain valid data that represent the entire population.
Descriptive Research Examples
Some examples of descriptive investigations may be the following:
Penguin census
Studying the penguin population that exists in the South Georgia Islands is a descriptive investigation that answers the what and where. Advantages and disadvantages of descriptive research
National census
The research carried out in a national census is descriptive, since it is only interested in data such as the number of population, the salary they receive, or what class the household is, without making any kind of analogy between these. .
Carrying out a descriptive investigation that collects data about the political party that people will choose in the next elections, it is possible to predict, with a margin of error , the result that will be obtained in them.
Supermarket
Using observation, qualitative data can be collected on the habits of supermarket customers regarding the purchases they make in it. Advantages and disadvantages of descriptive research
Kids playtime
Through the resource of the survey , it is possible to carry out a descriptive investigation that yields information about the number of hours per day that children in a particular population play. Being able to make a forecast of the weather that a particular child of that city plays.
Related Articles

Indirect observation features advantages disadvantages example

General and specific objectives Similarities Differences and FAQs
What are citations/types/search tools to manage, validity and reliability in research/types/three attributes, leave a reply cancel reply.
Your email address will not be published. Required fields are marked *
Save my name, email, and website in this browser for the next time I comment.

Please input characters displayed above.
- What is factor analysis in research/Why use/Methods/models March 29, 2023
- Statistics Tutorials
- Calculators
- Book Recommendations
Advantages and Disadvantages of Descriptive Statistics

Masses of unorganized data — such as the census of population, the weekly earnings of thousands of computer programmers, etc. — are of little value as is. However, descriptive statistics can be used to organize data into a meaningful form. Descriptive statistics refers to methods of organizing, summarizing, and presenting data in an informative way.
Once we have identified our population and collected the sample data, our goal is to describe the characteristics of the sample in an accurate and unambiguous fashion in such a way that the information will be easily communicated to others. Describing, or just summarizing, the data can be done in two ways – either graphically or numerically. We now list some of the advantages and disadvantages of descriptive statistics.
Advantages of Descriptive Statistics:
- Descriptive statistics allows us to present the data in graphical formal. Data presented in a visual form is much easier to understand. Qualitative data can be presented in the form of bar charts and pie charts. Numerical data can be presented in the form of dot plots and histograms.
- The various statistical measures allow us to summarize the central characteristics of the data. For example, the mean measures the central tendency of the data values. This allows us to obtain a rough understanding of where the data values lie. This is very important when we are dealing with a large amount of numerical data.
- The measures of dispersion such as standard deviation help us to understand how far the data values are spread away from each other. This is important because it is not easy to determine how spread apart the data values are when dealing with huge data sets.
- We can understand the shape of the distribution by computing the measures of skewness and kurtosis.
- Correlation analysis allows us to compare two different characteristics and check whether there is any relation between them. For example, we can check whether there is any correlation between height and weight by computing the correlation coefficient of the heights and weights of a sample of 100 individuals.
Disadvantages of Descriptive Statistics:
- We cannot use descriptive statistics to make any kind of predictions on the basis of the given data values. The tools of inferential statistics such as regression analysis allow us to make predictions about future values of the variable.
- The data collection process is generally time-consuming and expensive. For example, conducting a survey in order to collect data involves a lot of work. It is a time-consuming process and quite expensive since we need to train and pay the interviewers who conduct the survey.
- Descriptive statistics can be misused in order to deceive and give a false impression to the general public. For example, simply changing the scale of a graph can lead to misleading conclusions by a layman not trained in statistics.
I have always been passionate about statistics and mathematics education.
I created this website to explain mathematical and statistical concepts in the simplest possible manner.
If you've found value from reading my content, feel free to support me in even the smallest way you can.

Share this article
Recent posts, what is a frequency distribution table (with examples), what is a two way table (with examples), what is a relative frequency histogram (with examples), what is joint relative frequency (with examples), what is split half reliability (with examples), popular categories.
Recent comments
About Privacy Policy © Copyright - All Things Statistics

- Quantitative descriptive research: definition,types,methodology,methods,characteristics and examples
On this Page
- Introduction to Quantitative descriptive research
Types of survey research
Quantitative descriptive research methodology.
- Quantitative Descriptive Research Methodology-Diagrammatic Approach
- Logical Steps; Quantitative Descriptive Research Methodology
Quantitative descriptive research methods
Characteristics of quantitative descriptive research, advantages of quantitative descriptive research, disadvantages of quantitative descriptive research, quantitative descriptive research: definition, types,methodology,methods,characteristics,examples and advantages.
How do we define the term quantitative descriptive research? Is it the same as quantitative correlational research or quantitative causal-comparative? Look at this…
1.1 Definition
Quantitative Descriptive Research is a Non-Experimental type of research whereby the variables are measured using numerical terms although the variables under interrogation are not manipulated by the researcher. This type of research is commonly known as Descriptive Research as stated in our article on descriptive research which classifies types of research on the basis of “ purpose of research ”. In our current discussion, we are adding the word “quantitative” so as to emphasize that the variables are measured using numerical terms. Quantitative descriptive research uses two methodologies/designs, namely; observational research and survey research methodologies.
NOTE 1: Observational Research
Observational research is quantitative descriptive research where by data collection is done through observation. The design requires that the researcher collect data by devising a method where by although the process of data collection is through observation, the information is translated in to numeric form such as frequency, percentage, tally numbers etc. So, the key point here is that the researcher has to quantify character which have been observed. For example, if the researcher wants to measure corruption in a country. Then, he/she can design a method of using tally numbers such that anytime there is a case of corruption, then this is recorded in a tally sheet. Further, for the researcher to know how a country is corrupt, he/she will then compare the tally numbers in a certain period with the set benchmark tally score which has already been predetermined or given.
NOTE 2: Survey Research
Survey research is another type of quantitative descriptive research which advocates use of surveys or questionnaires to collect data pertaining the behavior of subject matter. It entails distributing of surveys or questionnaires to a big sample or the whole population if it is manageable so as to collect data. Since the purpose of this survey research is to describe physical characteristics of a population, it is much in order that the sample be selected using a probability sampling technique to ensure more accurate representation of the sample to the population.
Survey research can be classified in to three aspects based on the manner in which the researcher is formulating the research problem. These categories are; descriptive, cross-sectional, and longitudinal.
1.Descriptive Survey Research
It is a research design which is set to collect data for the simple purpose of describing the character of the subject matter. It is a one point in time approach of collecting data. For instance, if the researcher wants to study on the level of concentration of members in the church, he/she will randomly distribute the survey instruments to the selected sample and have them fill them and return as supposedly.
2.Cross-sectional Survey Research
It is a research design/study which involves investigation of features of different samples or populations where by the are taken at one point in time. For instance, the researcher may wish to carry out a measurement on cross-sectional study about the study habits of grade six pupils in two, three or four different schools in a certain location. All the pupils making up the sample would be surveyed at the same point in time. Where the cross-sectional survey is conducted for the whole population, it is referred to as a census.
3.Longitudinal Survey Research
It is a research design/study which involves the investigation of the characteristics of respondents where by the measurements are taken at different point in time. For instance, the researcher may wish to carry out longitudinal study on the study habits of grade six pupils in certain school in a particular location. All the pupils making up the sample would be surveyed at different point in time. In other words, the same group of participants is studied over an extended period of time, which naturally involves the administration of several surveys at particular time intervals such as after one year, after another one year and after another one year and so on and so on.
Longitudinal survey research is further categorized into;
T rend study is a longitudinal survey study that scrutinizes changes within a specifically identified population over time with an aim of learning the trend thereof for decision or planning purposes.
Cohort study is longitudinal research which investigates characteristics of a certain group which is a sub-group of another group which was being studied in the previous time. The sub-group is commonly referred to as “cohort”. The kind of longitudinal research happens when the initial group identified was being investigated over a certain characteristic and then further, another sub-group is picked from the previous main group to be investigated over another characteristic. The sub-group should be having the characteristics of the main group for it is a member. For example, a longitudinal study may focus on studying the sleeping habits of children who are under five years in certain families. If the researcher establishes that the children selected have that particular sleeping habit, another group out of this group (i.e., sub-group) is selected to find out if they know how to communicate fluently in their mother tongue. The sub-group being tested of their fluence in mother tongue is a cohort. Hence the study is cohort research.
Panel Research is a study which investigates a characteristic in the same group same sample over a long period. In a panel study, the researcher examines the exact same respondents over a specified time frame. For example, the researcher would select and survey a group of children in year 2018 survey the same children in 2020, and once again repeat the same interrogation for the same children in 2022. So, longitudinal study of panel type deals with the same sample, population or group over a long period set.
2.1 Definition
Quantitative Descriptive Research Methodology is the rational process or step by step blueprint on how to solve a research problem that entails a variable which can be measured numerically in terms of 0, 0.5, 1, 2, 3.3, 4…. nth digit etc. Quantitative Descriptive Research methodology involves selecting a logical process on the topic to be studied. That is the study or research problem, how specific objectives of the study will be recognized/or framed. Identification of research gaps to be filled, the methods used in documentation of the study population and sample size determination, type of data to be collected and how it will be collected and analyzed, data presentation and clarifications thereof and the broadcasting of the investigation outcome.
Quantitative Descriptive Research methodology is the intellectual aspect behind the methods we use in the context of our research study. This provides a groundwork as to why one is using a particular method or procedure at a specific phase in the research progression and not others so that research outcome is accomplished either by the researcher or another scholar.
2.2 Quantitative Descriptive Questions Research Methodology tries to Answer
Quantitative research aims at answering one aspect of a question. That is;
What kind of questions only!
The following matrix portrays the link between quantitative descriptive type of research and the type of research methodology adopted and then an explanation of the logical approach associated with this category and then in the last column, the research method(s) used in formulating the research problem. Remember these methods are specifically for quantitative descriptive research which is a sub-set of Quantitative research.
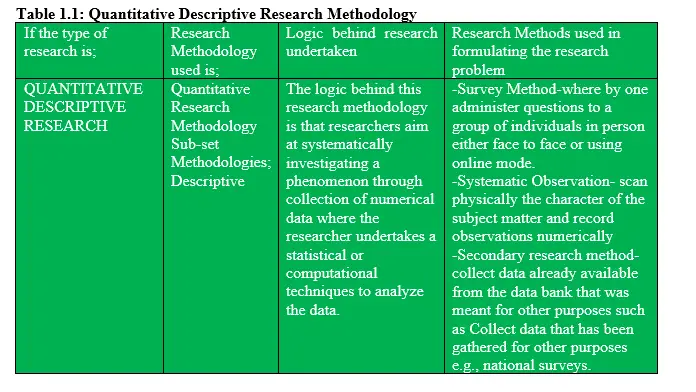
2.3 Quantitative Descriptive Research Methodology-Diagrammatic Approach
The following diagram represents a summary of logical roadmap to be adhered to in descriptive research methodology where Quantitative or Numerical methods are used to measure/gauge the study variables. This case is more biased on survey descriptive research.
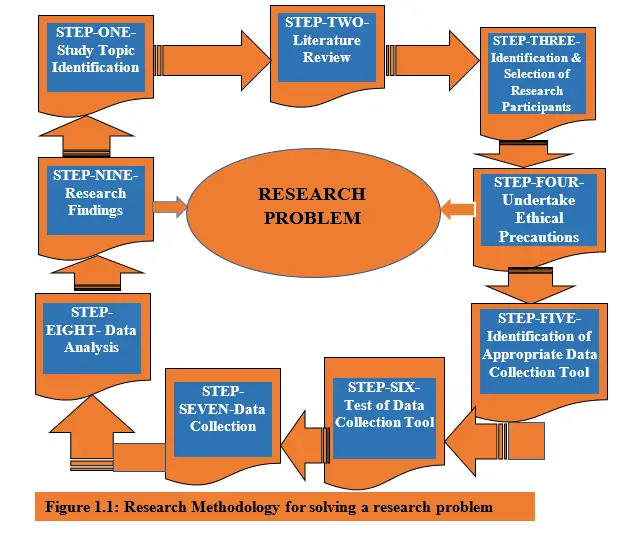
2.4 Logical Steps; Quantitative Descriptive Research Methodology
The following logical steps describe the Quantitative Descriptive Research methodology. From step one to nine, it represents a logical way of how systematically the subject matter need to be dealt with. Remember that in this approach, the researcher is only curious of establishing how things work.
2.4.1 Step 1; Topic Identification
This is the first step in Quantitative Descriptive research where by the researcher has to come up with the area of study based on the area of interest. Under step one, the researcher will embrace thematic topic by posing him/herself descriptive affiliated research questions such as “what is the purchases cost level of product M in the regional market?” OR
“What is the purchasing pattern of a certain magazine amongst the married people in Kingstone in Jamaica?”
2.4.2 Step 2: Literature Review
In this step, the researcher, interrogates past studies relevant to the area of interest or topic of study. The aim being to highlight the conceptual, methodological and contextual research gaps to help in development of the appropriate survey, interview inquiries/questions and framing of data collection procedures as well.
2.4.3 Step 3: Identification & Selection of Research Participants
Since the main aim of Quantitative descriptive research is to generalize the end results on the population, there is need at this stage to identify the target population . Out of this population, a sample is drawn using a probabilistic sampling technique so as to give each individual equal opportunity to participate in the study.
2.4.4 Step 4: Identification of Appropriate Data Collection Tool
This step involves identification of the most appropriate data collection tool by the researcher. Quantitative descriptive research has a wide spectrum of such tools such as direct administration of a survey, a mail survey, a telephone survey, interviews, e-mail surveys, and web-based surveys. The most suitable approach depends on circumstances prevailing which may favor one method as compared to another.
The researcher chooses the most suitable tool to collect data. Based on the nature or the circumstances the participants are in, the researcher can rely on either face-to-face survey, E-mail survey, a telephone call or survey, or interviews, to mention but a few.
2.4.5 Step 5: Undertake Ethical Precautions
After pre-determining the participants in the study and selecting the approach to use when collecting data, the next step is to disseminate survey to the sample selected, this is achieved by seeking permission from the right authority. So, the researcher prepares a cover or introductory letter to go together with the surveys. Basically, the content of the letter entails the message of assurance of privacy and confidentiality protection strategies for the respondents and also the benefits thereof.
2.4.6 Step 6: Test of Data Collection Tool
After choosing the right data collection tool, the next step is to assess the appropriateness of the tool. This can be achieved through many ways one of them being the pilot test. Pilot testing is a key process in data collection mission for the researcher has to ensure that the data collection tool is effective in capturing the information that is required for data analysis. The purpose of pilot testing of the data collection instrument/tool is to find out if the level of understandability of the respondents are as per the expectations. This approach avoids cases where by the questions in the tool are vague and not clear. It can be frustrating if the participants captured to play a role in the research assignment do not understand the questions or they may do wrong interpretation.
Therefore, a pilot test should be undertaken before actual data collection is carried out. This exercise entails randomly selecting a smaller sample from the main sample and go forth to collect data from respondents using the same data collection tool to test the waters. This process gives the researcher a hint on how effective the tool is and whether there is need to revise the tool before actual data collection. Classical authors such as Kothari (2009) and Sekaran (2006) recommend a 1% sample size for a pilot study and Mugenda and Mugenda (2009) too, states that the size of a sample for the purpose of piloting should be between 1% and 10% of the sample size. It is advisable to exclude the portion of sample used for piloting from main data collection exercise.
2.4.7 Step 7: Data Collection
As usual, in this step, the actual data is collected using the appropriate data collection tool. In this case, a survey tool is suitable if the data collected is quantitative descriptive in nature.
2.4.8 Step 8: Data Analysis
Data analysis for survey cases apply statistical/numerical procedures where hard statistics such as frequency distribution, descriptive statistics such as sample mean, sample standard deviation, sample variance, correlation coefficients and group comparisons are relevant.
2.4.9 Step 9: Research Findings
Research findings stage is the last step and the end to the means in research exercise. The step involves provision of solutions to the research question(s) the investigator had from the beginning. On getting the answers to the research questions, then the researcher can make inferences about the population.in other words, he/she can generalize.
Does quantitative descriptive research methods for formulating a research problem the same as quantitative descriptive research method for data analysis ? The answer is NO. Look at the definitional differences as per our explanation below
3.1 Definition
Research methods are all the techniques that are utilized in all the stages of research processes. They are tools used to ensure the end results of research task are accomplished. These techniques vary from one stage of research process to another. These methods are further classified in to two categories, namely;
a) Pre-Data analysis methods
b) Data Analysis related methods
Quantitative descriptive research uses survey, systematic observation and secondary research methods for the purposes of formulating the research problem which are some of the methods which fall under pre-data analysis category. However, in this discussion of Quantitative descriptive research, we will focus on main methods of data collection which are also pre-data analysis in nature. That is; observation and survey methods.
Observation data collection method
As discussed earlier, this method involves collecting of data by doing observation of the respondent’s character in the natural/physical settings. The data should be recorded in numeric terms or mode.
Survey Data Collection Method
This method of data collection involves use of questionnaires and other different types of surveys to capture the respondent’s characteristics. Those types of surveys are, namely; direct administration of surveys, mail surveys, telephone surveys, interviews, e-mail surveys, and web-based surveys.
Direct Administration Survey
Direct administration survey is a method of data collection applicable when the whole population is reachable. All the members of the targeted population are available and it is possible to collect data at 100% assurance level. The researcher disseminates the survey instrument on his own without a research assistant. This approach translates in to a very high survey return rate which assures the researcher valid results. This approach works well when the researcher is in proximity to the location where the respondents are.
Mail surveys data collection method
As the name suggests, mail survey data collection method is an approach of distributing surveys to the potential respondents by using mails. It involves administering the survey instrument to the population or the sample identified whereby a hard copy is issued and the researcher expects the survey to be filled and returned as soon as stated in the instructions given. Mail survey method enables the researcher to cover a wider coverage of the respondents although it is a little bit expensive.
Telephone surveys data collection method
As the name suggests, the method uses telephone gargets to communicate with the respondents. This has proven to be costly. The method entails making calls either using land line telephones or cell phones to communicate. This survey method requires both parties to be having a phone handset and the surveyor has to recite all the questions to avoid making mistakes when interrogating the respondent.
Interview survey data collection method
Interview data collection method involves collection of data face to face whereby the researcher has to aval him/herself to the physical locale of the respondent. Interviews are costly for the researcher has to travel to and from and again if research assistants are used, then they have to be trained on the interview protocols to avoid ineffective responses from the participants.
E-Mail survey data collection method
As the name suggests, the method uses E-Mail accounts to communicate with the respondents. This has proven to be cheap. The method entails sending surveys to individual respondents using their e-mail accounts. This survey method requires both parties to be having an e-mail account that is active. The prepared survey is attached to the email platform and sent to the respondent who is expected to respond within a specific period.
Web-based survey data collection method
As the name suggests, the method uses website platform to communicate with the respondents. This is also cheap. The method entails sending surveys to individual respondents using their e-mail accounts via the sender’s website. This survey method requires the respondent to have a way of accessing information in the website. The prepared survey is attached to the website platform and sent to the respondent who is expected to respond within a specific period.
- Measurement of variables which represent the characteristics of the subject matter is in numeric form.
- Data collection is either through observation or surveys.
- The data is collected from the subject matter which is in its natural or physical phenomenon.
- There is no manipulation of the variables for this type of research is non-experimental in nature.
- Data is collected either at one data point or several data points.
- It is descriptive in nature-this research only aims at describing or giving a narration of the character of the subject matter and does not show any relationship or causality.
- Foundational-this research is the basis of other highly ranked research for it lays the basis of the nature of the variables that exists. Hence giving a hint of whether they correlate or cause other variables to change. This then becomes the basis for further research.
- Generalizability-research findings are always generalized. That is, the research findings gotten from the sample is used to generalize about the characteristics of the whole population.
- Objectivity-the researcher just observes the characteristics of the subject matter or unit of observation with his/her hands off from any manipulation. Hence no researcher biased influence.
- Time saving- this type of research is time saving especially when the method of observation is used.
- Increased response rate-the data collection that involves use of direct administration of survey instruments tend to have almost 100% survey response. Even when questionnaires are issued in this manner, the questionnaire response rate is very high.
- Wide coverage of data collection-the survey method of data collection especially when website and e-mail mode of distribution is used reaches far and wide places. This assures the researcher of sample size which is a true representation of the population under study.
- Cost effective-when collecting data using web-based survey and e-mail approach, fewer financial resources are utilized. Hence the research design is cheap.
- Efficient population representation-the sample size used in survey is always large enough to represent the whole population. This assures the researcher of valid data for conclusive research findings.
- Generalization- this type of research allows for generalization of research findings from the sample and therefore it is not a must to use the whole population which may be costly and time consuming.
- Customization-under quantitative descriptive research, there are various/wide optional methods of data collection such as one data point collection approach, many data point data collection, panel research design, cohort and so on and so on. These approaches make it possible to meet the needs of many stakeholders.
- Lack applicability in some circumstances-methods of reaching the respondents such as use of e-mails require both parties, that is the researcher and the respondents to have a cell phone or a computer. This is not the case especially in the rural areas for the developing economies.
- Outdated data-where data collection involves many data points in time, the old data collected may turn to be irrelevant in decision making. For example, if the researcher was collecting data on consumer behavior of customers loyal to product EXE of X company limited for the next ten (10) years. You see, by the time ten years will be over, the product version or customer taste will have changed to other more appealing products. So, the initial data pertaining product EXE will be useless.
- Does not show causality effects between or amongst variables. As the name suggests, quantitative descriptive research does not show cause-effect relationships between variables.
- Bias personal opinion-responses gotten from the survey study have high chances of being wrong. This is because the respondents may answer questions in a manner to please the researcher or the research assistant. This makes the data unreliable.


10 Advantages & Disadvantages of Quantitative Research
Quantitative research is a powerful tool for those looking to gather empirical data about their topic of study. Using statistical models and math, researchers evaluate their hypothesis.

Quantitative Research
When researchers look at gathering data, there are two types of testing methods they can use: quantitative research, or qualitative research. Quantitative research looks to capture real, measurable data in the form of numbers and figures; whereas qualitative research is concerned with recording opinion data, customer characteristics, and other non-numerical information.
Quantitative research is a powerful tool for those looking to gather empirical data about their topic of study. Using statistical models and math, researchers evaluate their hypothesis. An integral component of quantitative research - and truly, all research - is the careful and considered analysis of the resulting data points.
There are several key advantages and disadvantages to conducting quantitative research that should be considered when deciding which type of testing best fits the occasion.
5 Advantages of Quantitative Research
- Quantitative research is concerned with facts & verifiable information.
Quantitative research is primarily designed to capture numerical data - often for the purpose of studying a fact or phenomenon in their population. This kind of research activity is very helpful for producing data points when looking at a particular group - like a customer demographic. All of this helps us to better identify the key roots of certain customer behaviors.
Businesses who research their customers intimately often outperform their competitors. Knowing the reasons why a customer makes a particular purchasing decision makes it easier for companies to address issues in their audiences. Data analysis of this kind can be used for a wide range of applications, even outside the world of commerce.
- Quantitative research can be done anonymously.
Unlike qualitative research questions - which often ask participants to divulge personal and sometimes sensitive information - quantitative research does not require participants to be named or identified. As long as those conducting the testing are able to independently verify that the participants fit the necessary profile for the test, then more identifying information is unnecessary.
- Quantitative research processes don't need to be directly observed.
Whereas qualitative research demands close attention be paid to the process of data collection, quantitative research data can be collected passively. Surveys, polls, and other forms of asynchronous data collection generate data points over a defined period of time, freeing up researchers to focus on more important activities.
- Quantitative research is faster than other methods.
Quantitative research can capture vast amounts of data far quicker than other research activities. The ability to work in real-time allows analysts to immediately begin incorporating new insights and changes into their work - dramatically reducing the turn-around time of their projects. Less delays and a larger sample size ensures you will have a far easier go of managing your data collection process.
- Quantitative research is verifiable and can be used to duplicate results.
The careful and exact way in which quantitative tests must be designed enables other researchers to duplicate the methodology. In order to verify the integrity of any experimental conclusion, others must be able to replicate the study on their own. Independently verifying data is how the scientific community creates precedent and establishes trust in their findings.
5 Disadvantages of Quantitative Research
- Limited to numbers and figures.
Quantitative research is an incredibly precise tool in the way that it only gathers cold hard figures. This double edged sword leaves the quantitative method unable to deal with questions that require specific feedback, and often lacks a human element. For questions like, “What sorts of emotions does our advertisement evoke in our test audiences?” or “Why do customers prefer our product over the competing brand?”, using the quantitative research method will not derive a meaningful answer.
- Testing models are more difficult to create.
Creating a quantitative research model requires careful attention to be paid to your design. From the hypothesis to the testing methods and the analysis that comes after, there are several moving parts that must be brought into alignment in order for your test to succeed. Even one unintentional error can invalidate your results, and send your team back to the drawing board to start all over again.
- Tests can be intentionally manipulative.
Bad actors looking to push an agenda can sometimes create qualitative tests that are faulty, and designed to support a particular end result. Apolitical facts and figures can be turned political when given a limited context. You can imagine an example in which a politician devises a poll with answers that are designed to give him a favorable outcome - no matter what respondents pick.
- Results are open to subjective interpretation.
Whether due to researchers' bias or simple accident, research data can be manipulated in order to give a subjective result. When numbers are not given their full context, or were gathered in an incorrect or misleading way, the results that follow can not be correctly interpreted. Bias, opinion, and simple mistakes all work to inhibit the experimental process - and must be taken into account when designing your tests.
- More expensive than other forms of testing.
Quantitative research often seeks to gather large quantities of data points. While this is beneficial for the purposes of testing, the research does not come free. The grander the scope of your test and the more thorough you are in it’s methodology, the more likely it is that you will be spending a sizable portion of your marketing expenses on research alone. Polling and surveying, while affordable means of gathering quantitative data, can not always generate the kind of quality results a research project necessitates.
Key Takeaways

Numerical data is a vital component of almost any research project. Quantitative data can provide meaningful insight into qualitative concerns. Focusing on the facts and figures enables researchers to duplicate tests later on, and create their own data sets.
To streamline your quantitative research process:
Have a plan. Tackling your research project with a clear and focused strategy will allow you to better address any errors or hiccups that might otherwise inhibit your testing.
Define your audience. Create a clear picture of your target audience before you design your test. Understanding who you want to test beforehand gives you the ability to choose which methodology is going to be the right fit for them.
Test, test, and test again. Verifying your results through repeated and thorough testing builds confidence in your decision making. It’s not only smart research practice - it’s good business.
About Author

Send Your First Survey Today!
Set up and begin receiving results within minutes. Sign up for free, no contract required.
Helpfull is the easiest way to get feedback from thousands of people in minutes. Our online focus group platform provides a pool of qualified panelists to give you their real detailed opinions helping you make better, more informed decisions.
IMAGES
VIDEO
COMMENTS
INTRODUCTION. In our previous article in this series, [ 1] we introduced the concept of "study designs"- as "the set of methods and procedures used to collect and analyze data on variables specified in a particular research question.". Study designs are primarily of two types - observational and interventional, with the former being ...
Quantitative: Descriptive research design is quantitative in nature, which means that it involves collecting numerical data that can be analyzed using statistical techniques. This helps to provide a more precise and accurate description of the population or phenomenon. ... Some of the main advantages of descriptive research design are: Provides ...
Descriptive research methods. Descriptive research is usually defined as a type of quantitative research, though qualitative research can also be used for descriptive purposes. The research design should be carefully developed to ensure that the results are valid and reliable.. Surveys. Survey research allows you to gather large volumes of data that can be analyzed for frequencies, averages ...
One of the biggest advantages of descriptive research is that it allows you to analyze facts and helps you in developing an in-depth understanding of the research problem. ... In such a type of investigation, you can utilize both qualitative and quantitative research methods for gathering facts. Descriptive research is cost-effective and quick ...
Quantitative research: It is a quantitative research method that attempts to collect quantifiable information for statistical analysis of the population sample. It is a popular market research tool that allows us to collect and describe the demographic segment's nature. ... Advantages of descriptive research. Some of the significant ...
Descriptive research design. Descriptive research design uses a range of both qualitative research and quantitative data (although quantitative research is the primary research method) to gather information to make accurate predictions about a particular problem or hypothesis. As a survey method, descriptive research designs will help ...
Quantitative nature: Some descriptive research types involve quantitative research methods to gather quantifiable information for statistical analysis of the population sample. ... Advantages of descriptive research. There are several advantages to this approach, which every researcher must be aware of. These are as follows:
1. Purpose. The primary purpose of descriptive research is to describe the characteristics, behaviors, and attributes of a particular population or phenomenon. 2. Participants and Sampling. Descriptive research studies a particular population or sample that is representative of the larger population being studied.
Quantitative research methods. You can use quantitative research methods for descriptive, correlational or experimental research. In descriptive research, you simply seek an overall summary of your study variables.; In correlational research, you investigate relationships between your study variables.; In experimental research, you systematically examine whether there is a cause-and-effect ...
Descriptive Analysis is the type of analysis of data that helps describe, show or summarize data points in a constructive way such that patterns might emerge that fulfill every condition of the data. It is one of the most important steps for conducting statistical data analysis. It gives you a conclusion of the distribution of your data, helps ...
One of the biggest advantages of having experimental research is the investigator have a ... The researchers employed a quantitative descriptive-correlational research design to determine the ...
Advantages of Descriptive Research . Effective to analyse non-quantified topics and issues; The possibility to observe the phenomenon in a completely natural and unchanged natural environment; The opportunity to integrate the qualitative and quantitative methods of data collection. Accordingly, research findings can be comprehensive.
Descriptive research designs use a variety of methods such as observation, case studies, and surveys to collect data. The data is then analyzed using statistical tools to identify patterns and relationships. ... Advantages of Quantitative Research. There are several advantages of quantitative research, including:
Quantitative research designs are either descriptive [subjects usually measured once] or experimental [subjects measured before and after a treatment]. A descriptive study establishes only associations between variables; an experimental study establishes causality. Quantitative research deals in numbers, logic, and an objective stance.
Descriptive Analytics. Definition: Descriptive analytics focused on describing or summarizing raw data and making it interpretable. This type of analytics provides insight into what has happened in the past. It involves the analysis of historical data to identify patterns, trends, and insights. Descriptive analytics often uses visualization ...
Numeric data collected in a research project can be analysed quantitatively using statistical tools in two different ways. Descriptive analysis refers to statistically describing, aggregating, and presenting the constructs of interest or associations between these constructs.Inferential analysis refers to the statistical testing of hypotheses (theory testing).
Quantitative research methods are concerned with the planning, design, and implementation of strategies to collect and analyze data. Descartes, the seventeenth-century philosopher, suggested that how the results are achieved is often more important than the results themselves, as the journey taken along the research path is a journey of discovery. . High-quality quantitative research is ...
In most cases, descriptive research gets data on quantities, not qualities . It is for this reason that it can be said that a descriptive research is quantitative. Advantages and disadvantages of descriptive research. Even so, there is also the possibility of obtaining qualitative data.
Advantages of Descriptive Statistics: Descriptive statistics allows us to present the data in graphical formal. Data presented in a visual form is much easier to understand. Qualitative data can be presented in the form of bar charts and pie charts. Numerical data can be presented in the form of dot plots and histograms.
Advantages of quantitative descriptive research. Objectivity-the researcher just observes the characteristics of the subject matter or unit of observation with his/her hands off from any manipulation. Hence no researcher biased influence. Time saving- this type of research is time saving especially when the method of observation is used.
5 Disadvantages of Quantitative Research. Limited to numbers and figures. Quantitative research is an incredibly precise tool in the way that it only gathers cold hard figures. This double edged sword leaves the quantitative method unable to deal with questions that require specific feedback, and often lacks a human element.